

Forecast Pro allows you to open multiple views in the View Window. These views may be resized, maximized or minimized and arranged as you wish using standard Windows functionality. Left click on the border of an open window and drag the mouse to resize and left click on a window’s title bar and drag the mouse to move the window.
You may also tile the open views using Auto Arrange icon on the Home tab and Quick Access Toolbar. This can be helpful when you open a new view. The drop-down on the Auto-Arrange icon allows you to tile windows vertically instead.
Each Forecast Pro view has a hamburger menu on the upper left-hand corner. This menu can be used to access key functionality, such as opening the settings dialog for the view or adding filters to the report.
When you add filters to a report, Forecast Pro includes a filter drop-down on each column. If you click on the filter drop-down, you will bring up a dialog box that allows you to sort and filter values.
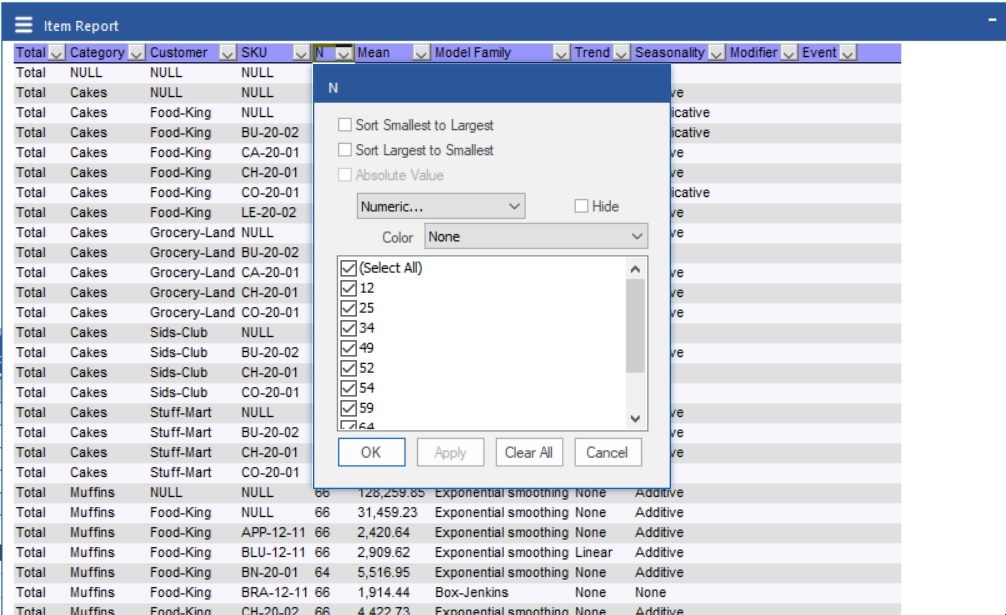
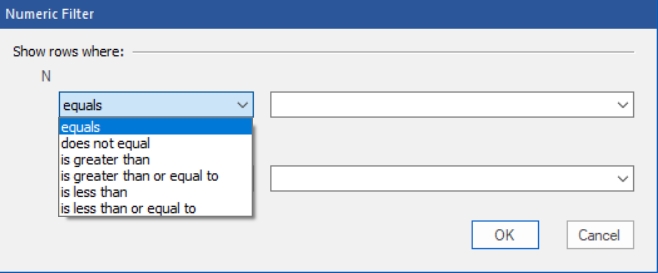
On the drop-down currently selected Numeric, you may select Numeric, Top 10, Above Average or Below Average. The Above Average and Below Average selections are self-explanatory. Selecting Numeric brings up a dialog box that allows you to enter logic for how the report should be filtered.
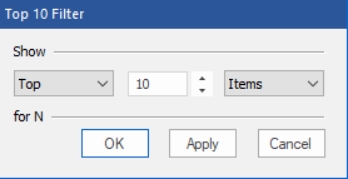
Selecting Top 10 brings up a dialog box that allows you to show the top or bottom items, based on number of items, percent or volume. While the default is to show the top 10 items, you can change the 10 to whatever value you wish to see.
Finally, you may add heat maps to numeric columns by selecting from the Color drop-down. The heat map colors a cell based on where the cell value falls in the range of values for the column. The default selection, None, is to not use a heat map. The drop-down provides different color schemes to select from. If you choose a color scheme, a heat map with the selected color scheme will be applied to the column specified.
Each Forecast Pro view also has a context menu. Right click anywhere on an open view to bring up the context menu. The context menu has the same selections as the hamburger menu which is accessible in the top left corner of each view.
There are eight view windows available in Forecast Pro. The following are context specific:
Context specific views display information for the current Navigator selection and update automatically as you move about the Navigator.
The remaining four views are global and include: