
The Forecast Report view is a scrollable text display containing information about the forecasts and how they were generated. It provides a convenient way to view information while using Forecast Pro. The Forecast Report can be exported, but it can potentially be a very large file. For this reason, you should consider using another report designed for exporting (e.g. Numeric Output Report), or only export a subset of items in the Forecast Report.
The Forecast Report is opened and closed with the Forecast Report icon on the Home tab or the Reports tab.
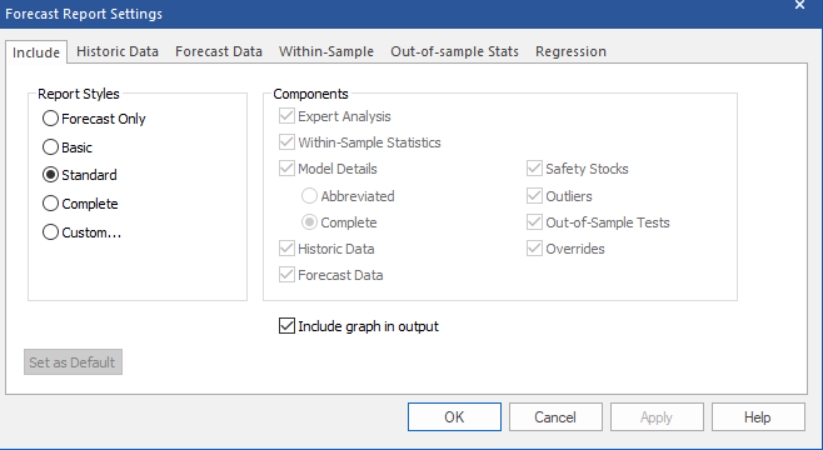
The Forecast Report Settings dialog box allows you to customize the Forecast Report view. This dialog box is invoked by selecting Settings on the Forecast Report icon drop-down on the Reports tab, by selecting Settings from the Forecast Report view’s context menu, or by selecting Settings on the hamburger menu in the upper left corner of the view window.

You can either select one of the four standardized report styles or define a custom report. Include graph in output can be used in conjunction with any style report and specifies whether to include or omit a graph when saving a Formatted Forecast Report to Excel. The settings for the saved graph may be specified in the Graph view, as described below. A description of each report style appears below.
Forecast Only is a minimal display consisting solely of the forecasts.
Basic displays a listing of the forecasting model used, a set of the commonly used within-sample statistics and a forecast display including confidence limits and summary statistics.
Standard is the default display. It includes the expert selection logic (if applicable), the model details including model coefficients, a full set of within-sample statistics, a safety stock display, a listing of detected/corrected outliers (if outlier detection is active), a listing of any overrides and the same forecast display found in the Basic style.
Complete displays everything found in the Standard display as well as a numeric listing of the historic values, fitted values, converted forecasts and an expanded forecast display.
Custom gives you complete control over what is included in the display. The Historic Data, Forecast Data, Within-Sample, Out-of-Sample and Regression tabs on the Forecast Report Settings may be used to specify details about the components to include when Custom is selected. Your selections under the Custom option are automatically retained for the project allowing you to switch between the Custom style and one or more of the standard styles without having to reset your custom settings.
Important note: The Within-sample and Out-of-sample Stats tabs allow you to set the numeric precision for the within-sample and out-of-sample statistics. You also may set precision for regression model details on the Regression tab. These precision settings are used for all report styles.