
The Numeric Output view displays the contents and format of the currently specified Numeric Output file. When designing the Numeric Output file, it is useful (though not necessary) to have the Numeric Output view open. To open the Numeric Output Report, click the Numeric Output icon on the Reports tab or select Show from the Numeric Output icon drop-down on the Home tab.
The Numeric Output Settings dialog box is used to specify the format and content of the Numeric Output Report and file. To open the Numeric Output Settings dialog box, select Settings from the drop-down on the Numeric Output icon on the Home tab or the Reports tab. You may also select Settings on the view’s hamburger menu or the view’s context menu to open the Numeric Output Settings dialog box.
The Numeric Output Settings dialog box contains both a Set as Default button and an OK button. Clicking the OK button will save your current settings for use with the current project and close the dialog box. Clicking the Apply button will also save your current settings for use with the current project, but the dialog box will remain open so you can continue changing the settings. Clicking the Set as Default button will save your current settings as the default settings for all new projects.
The Numeric Output Settings dialog box contains three pages or tabs. We will discuss each tab in turn.

The Output Format tab is used to specify the basic layout for the Numeric Output file.
The Output Section
Forecast file prefix. Specify the character(s) to use as the default prefix when naming the Numeric Output file. If the Single Output file option is selected in the Layout section, the default Numeric Output filename will be the prefix followed by the project name followed by “Numeric Output”. If the Single Output file option is not selected, each output filename will be the prefix followed by the corresponding input filename.
Include row totals. If this option is selected, the Numeric Output file with include a column on the far right of the report, called Total, that contains the totals for all entries in each row.
Include column totals. If this option is selected, the Numeric Output file with include a row on the bottom of the report, called Total, that contains the totals for all entries in each numeric column.
Include yearly totals. If this option is selected, the Numeric Output file with include columns that contains the totals for each year. Each year column will be inserted to the right of the last period in each year.
The Layout Section
Single output file. If Single output file is selected, a single Numeric Output file containing information for all forecasted items will be written. If Single output file is not selected, then a separate Numeric Output file will be written for each input file.
Break record up into lines. If selected, each Numeric Output component specified on the Time Series Data tab (see below) will appear on a separate line of the Numeric Output file.
Transactions. If selected, the data will be output using a transaction style layout (see Transactions Format). Transactional reports can only include time series data.
The Text Format section of this tab allows you to specify the conventions to use when outputting a text file. You will only be able to edit these settings when the data mode is set to Txt (text) or Mlt (text input file format).
The Pareto section allows you to include the Pareto codes and associated Pareto statistics in the Numeric Output view and output.

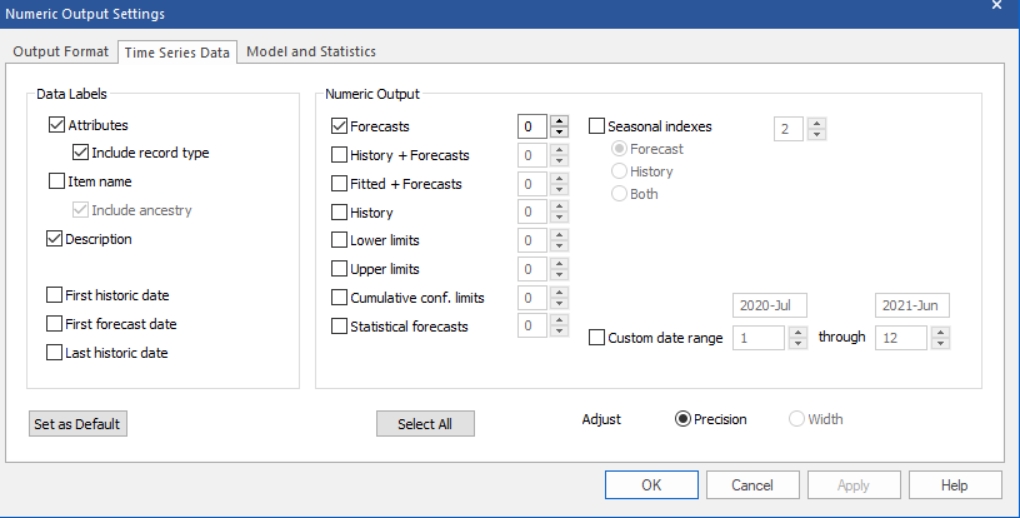
The Time Series Data tab is used to define the data label fields, to select the forecast components to include and to set their precision.
The Data Labels Section lets you specify what information you want to include for each item in the report.
Attributes. Include separate attribute fields for each level of the hierarchy. If you used attribute fields in your input data files to define groups, you will most likely want to select this option so that your output file will match your input file. Consult Using Attribute Fields to Define a Hierarchy for a discussion of attribute fields.
Include record type. Include a record type field that identifies which forecast component is being output. This is useful if you use the Break record up into lines option and are outputting more than one numeric output component.
Item Name. Include a field listing the “name” of the variable as it appears on the Navigator. If the Include ancestry option is active, the ancestry will be shown as part of the item name. If Include record type is not active, then the variable names used for all numeric output components other than “Forecasts” will include a suffix indicating the record type.
Description, Units, First historic date, First forecast date and Last historic date. Include fields for the selected options.
The Numeric Output Section lists the different types of data series you can include in the report.
History and Forecast Components. Check the boxes next to the information you want to include. Use the radio buttons under Seasonal Indexes to indicate if you want to include indexes for historic periods and/or the forecast horizon. The spinners next to the items are used to specify the numeric precision of the selected series. If the precision is set to 0, the numbers will not include a decimal.
Custom Date range. By default, the Numeric Output Report will include all forecast periods if a forecast is selected and all history periods if history is selected. If you want to change the periods shown in the report, select Custom date range and use the spinners to define the beginning and ending dates.
If you are outputting a fixed width text file, you may set the column widths instead of the numeric precision by selecting Width in the Adjust radio buttons.

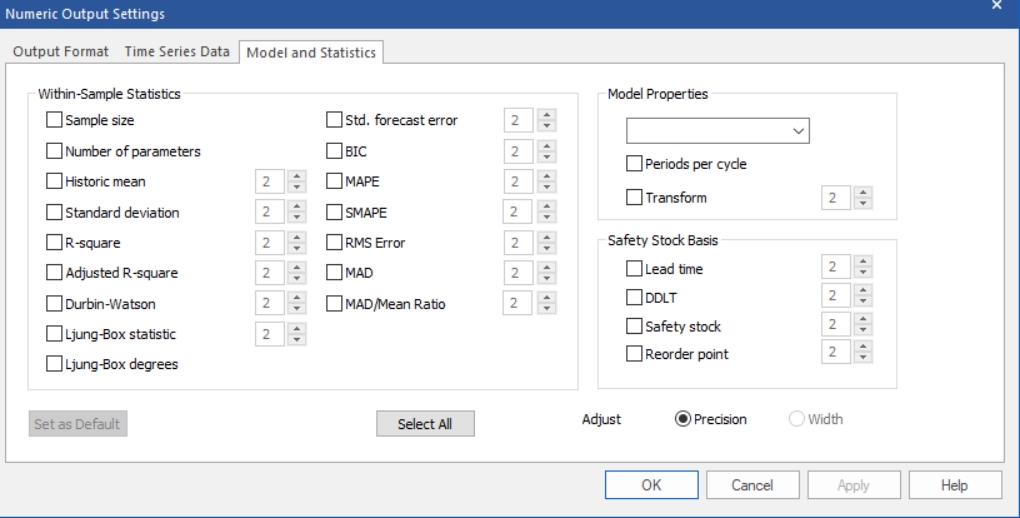
The Model and Statistics tab is used to define the within-sample statistics and model details that you wish to include and to set their precision. If you are outputting a fixed width text file, you may set the column widths instead by selecting the Width radio button instead on Precision. The spinners next to the Within-Sample Statistics selections and the Safety Stock Basis selections will apply to column width or numeric precision accordingly.
Most of the options are self-explanatory. However, we have noted some details below.
Model Properties. The Model Properties drop-down contains fields that describe the forecasting model selected. ModelSpec is a concise description of the model used. The notation that is used here is also used in the Forecast Report. Consult the Forecast Pro Statistical Reference Manual for further details.
Transform. The Box-Cox transformation power. 1 indicates no transform, .5 the square root and 0 the natural log.