

The Reports tab provide access to all Forecast Pro Views. Details for each of these views are in the Forecast Pro Views chapter.
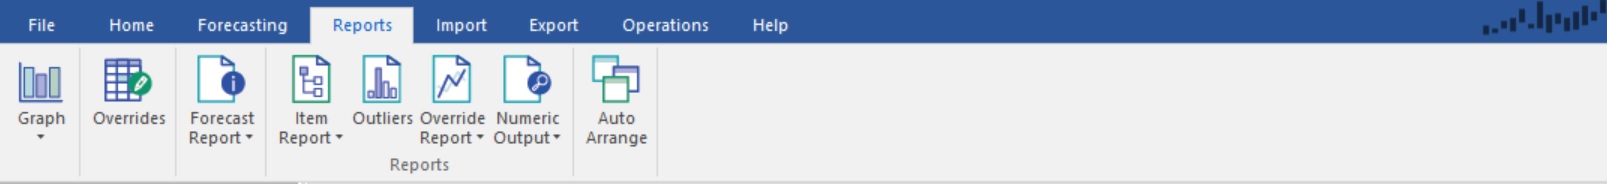
Graphs: Click on the Graphs icon to open and close a Graph view for the item selected in the Navigator. Up to four additional graphs may be added to the view window by selecting Add Graph on the Graph icon drop-down. Finally, you may select Diagnostics on the Graph icon drop-down to open the Diagnostics view.
Overrides: The Override icon opens and closes the Override view, which allows you to adjust forecasts for the item selected in the Navigator.
Forecast Report: The Forecast Report icon opens and closes the Forecast Report. The Forecast Report view displays the forecasting model, within-sample statistics, the historic data and forecasts for the selected item.
Reports Group: The Reports group includes the following:
Item Report: The Item Report icon opens and closes the Item Report. Item Reports may contain time series output such as history, forecasts, fitted values and confidence limits as well as statistical output such as the forecasting model specification and summary statistics. The drop-down on the Item Report icon allows you to open the Settings dialog box associated with the Item Report. The functionality of the Item Report is essentially the same as the Numeric Output view, but the Item Report allows you to change the view without impacting the structure of the Numeric Output File.
Outliers: The Outliers icon opens and closes the Outlier Report, a global report that list all outliers identified in the project.
Override Report: The Override Report icon opens and closes the Override Report view that shows all overrides in the project.
Numeric Output: The Numeric Output icon opens your Numeric Output view. Numeric Output Reports can contain time series output such as history, forecasts, fitted values and confidence limits as well as statistical output such as the forecasting model specification and summary statistics. The drop-down on the Numeric Output icon allows you to open the Settings dialog box associated with the Numeric Output. Note that these setting are typically configured for exporting a file with a defined structure, so changing these settings may disrupt your forecasting process. Consult the Numeric Output View and Numeric Output Files for more details.