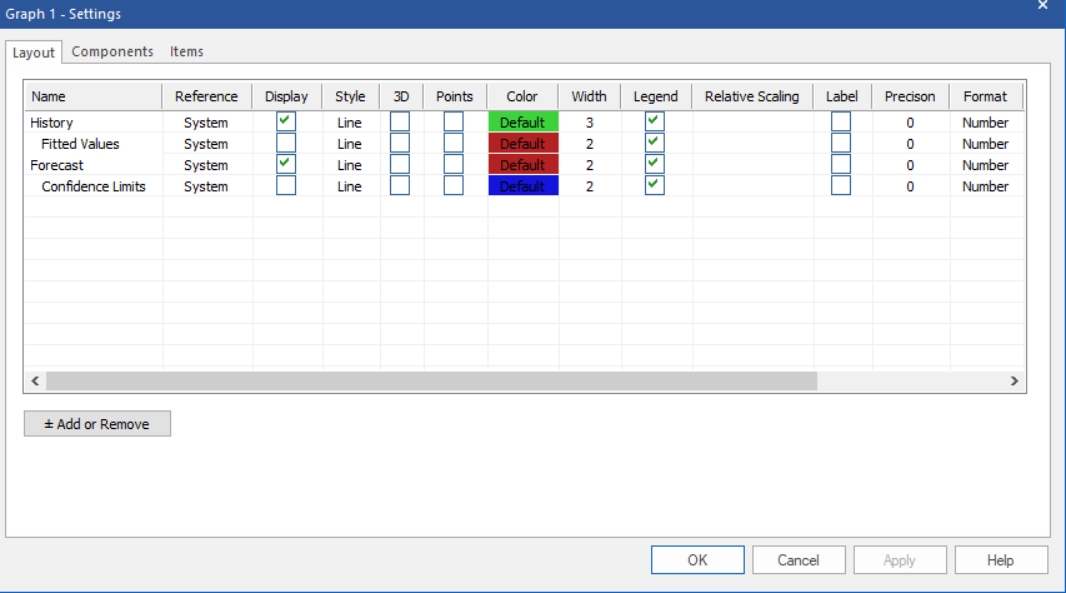


Right click on the Graph to invoke the context menu and select Settings. Select the Layout tab on the Graph Settings dialog box.

History, Fitted Values, Forecast and Confidence Limits are included in the default layout. Each listed row is displayed on the graph if the Display checkbox is selected. Note that Display is checked for both History and Forecasts, while Fitted Values and Confidence Limits are not checked.
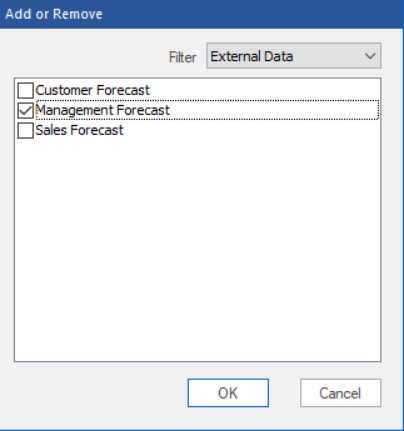
You can add additional rows to the Layout tab using the Add or Remove button. Click the Add or Remove button to invoke the Add or Remove Dialog box. You will see all rows that can be added to the Layout tab (and thus graphed) listed in the Add or Remove dialog box. On the top you can filter the list by the type of row (System, Calculated, External, etc.). Select External Data on the Filter drop-down selection box.

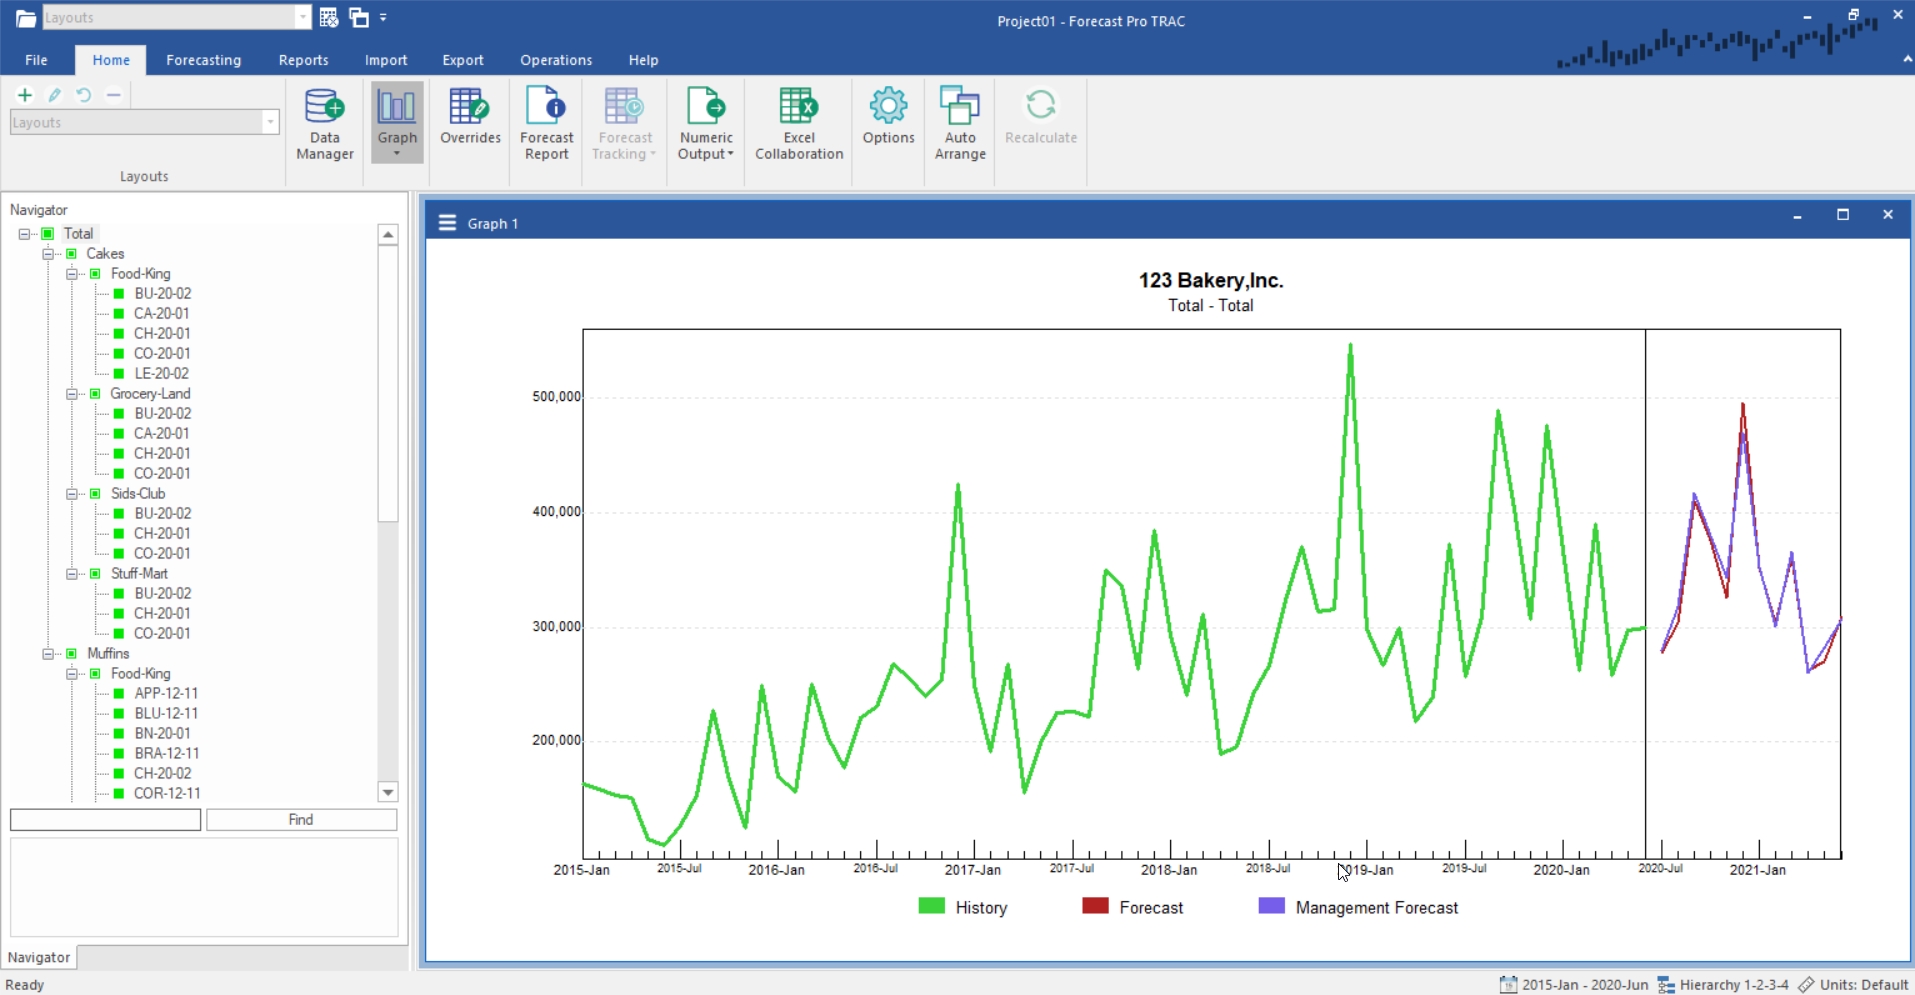
Check “Management Forecast” and click OK to return to the Layout tab of the Graph Settings dialog box. Notice that the Management Forecast row is now listed and that its’ Display field is checked. Click OK. Your display should now look like the one below.
