

Close the Override view by clicking on the Overrides icon or using the “X” close window control.
Maximize the Graph 1 view by maximizing the window or clicking the Auto Arrange icon on the Home tab.
Move the cursor to the Navigator and right click to bring up the Navigator’s context menu. Select Expand All.

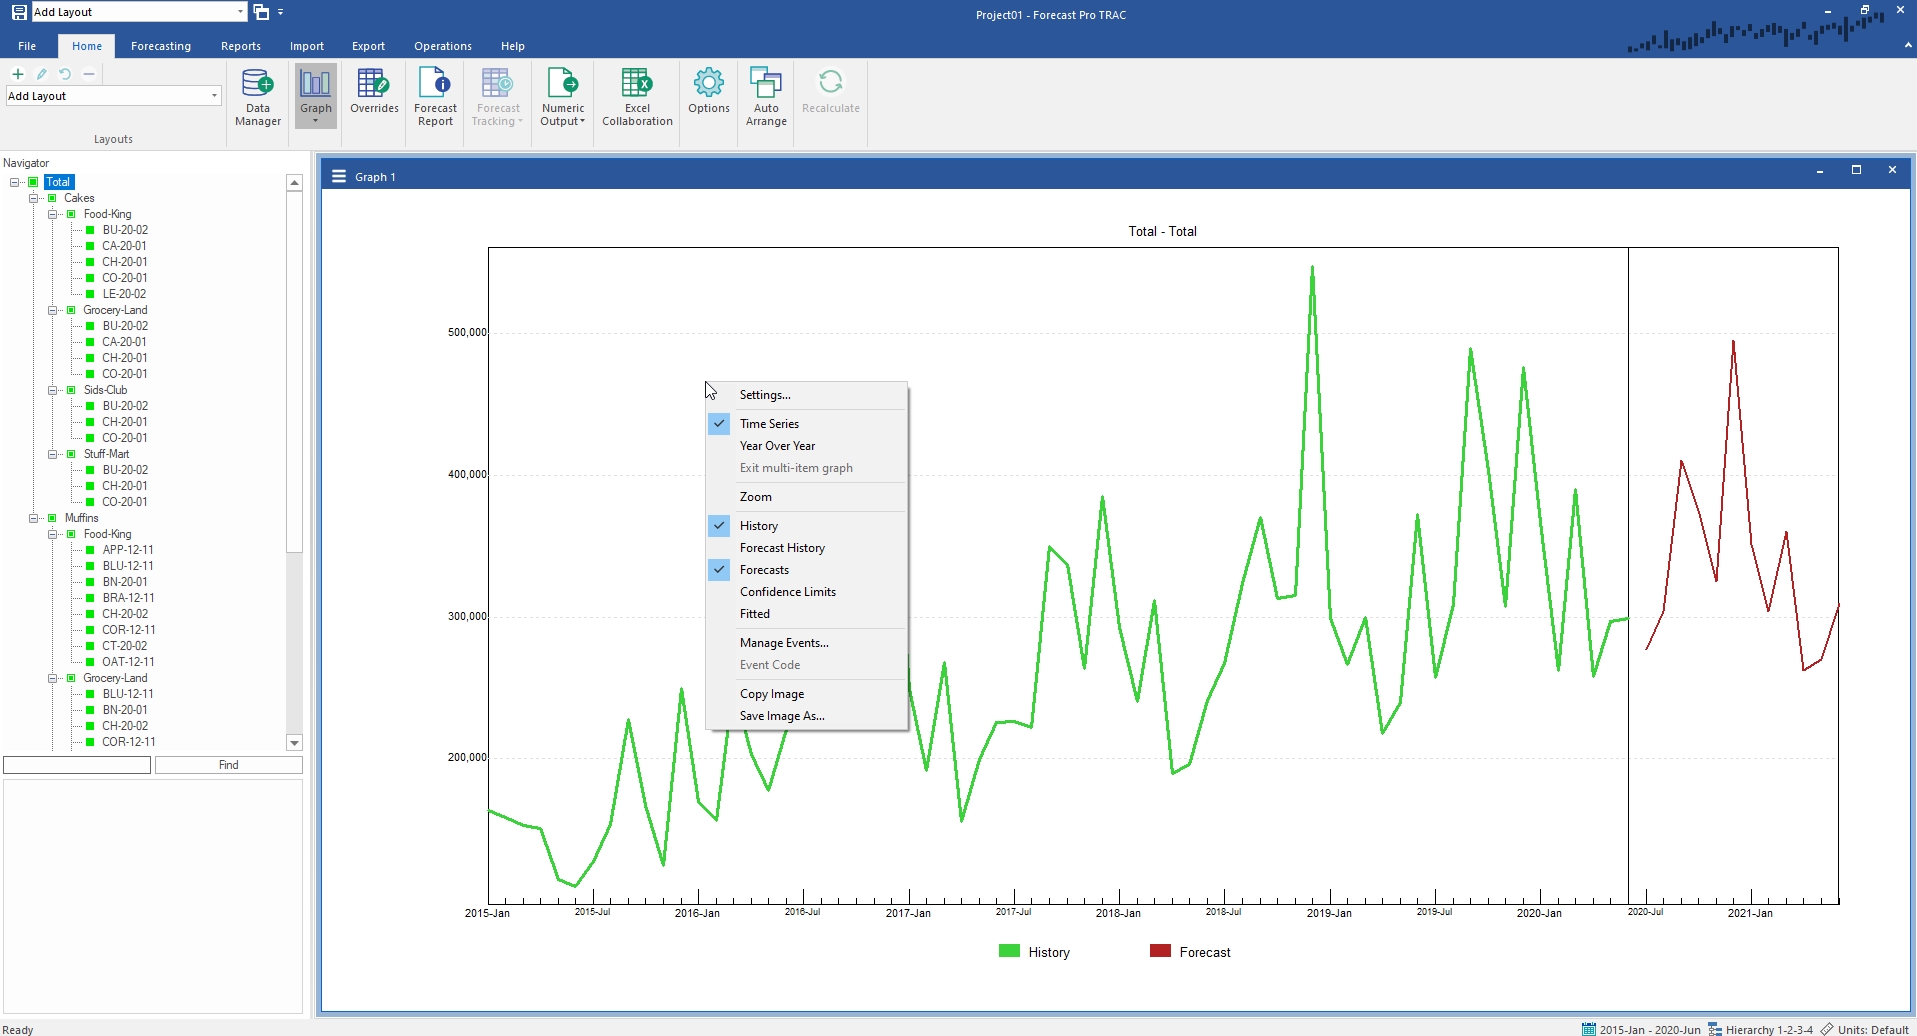
Right click on the graph to display the context menu. Your screen should now match the display above.
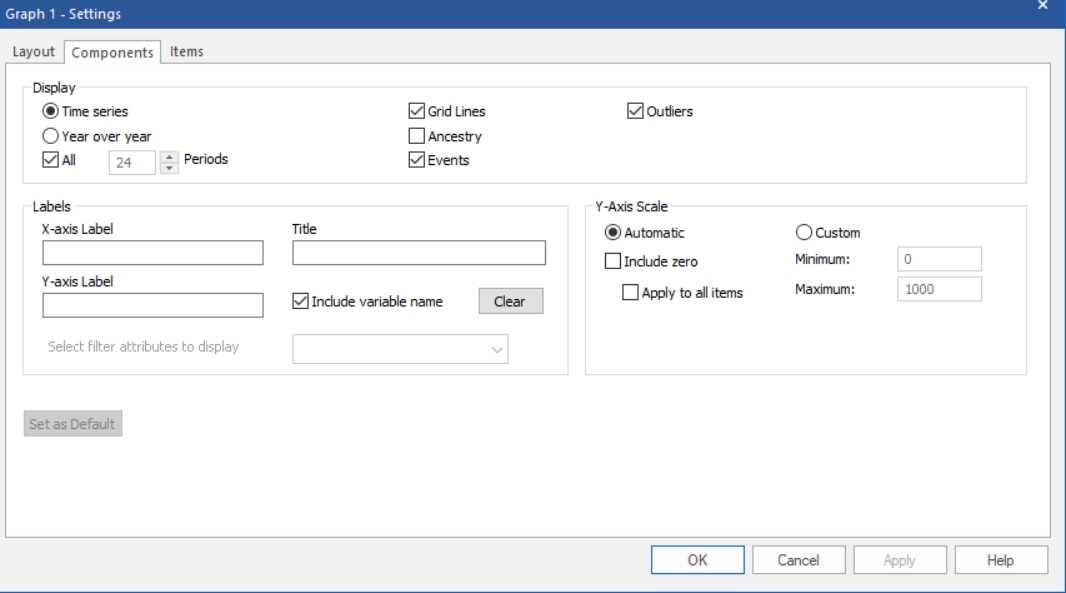
Notice that the forecast components (History, Forecast, Confidence Limits and Fitted Values) can be toggled on or off. Select Settings on the Graph context menu to invoke the Graph Settings dialog box. The Graph Settings dialog box includes three tabs. The Layout tab allows you to specify how each series should be displayed, the Components tab specifies global display options and the Items tab allows you to display multiple items on the same graph.
Select the Components tab.

Type “123 Bakery, Inc.” in the Title field and click the Apply button. Notice that the title has been added to the graph. Clicking the Apply button implements your current selection without leaving the Graph Settings dialog box, while clicking OK implements your current selection and exits the dialog box.
Forecast Pro supports two types of item-specific graphs—time series and year over year. Select Year over Year. Notice that the display is redrawn as a year over year graph and that there is a spinner enabling us to specify how many years to include. Because time series graphs and year over year graphs are distinctly different, you may want to format them differently (e.g., make the year over year a bar graph and the time series a line graph). If you plan on using different formatting options for different types of graph, keep in mind that layouts provide an easy way to switch between different formatted displays.
Select Time series. When you are viewing a time series graph, you have the option of displaying the data in a non-scrollable display or “zooming in” and graphing a subset of the data. Remove the check from the “All” option and click OK. Notice that the graph now displays 24 data points and is scrollable. Use the horizontal scrollbar to scroll through the display.
Right click on the graph to display the context menu. Notice that since you are currently zoomed in the Zoom toggle is checked. Toggle Zoom off to graph the full data set.