

Because ensemble models involve multiple models, it is difficult to summarize the impact of an individual feature on demand in the same way that you can with coefficients for dynamic regression or indexes for exponential smoothing. Instead of showing the size or direction of the impact of a feature on demand, Forecast Pro shows the relative importance of a feature in the ensemble model.
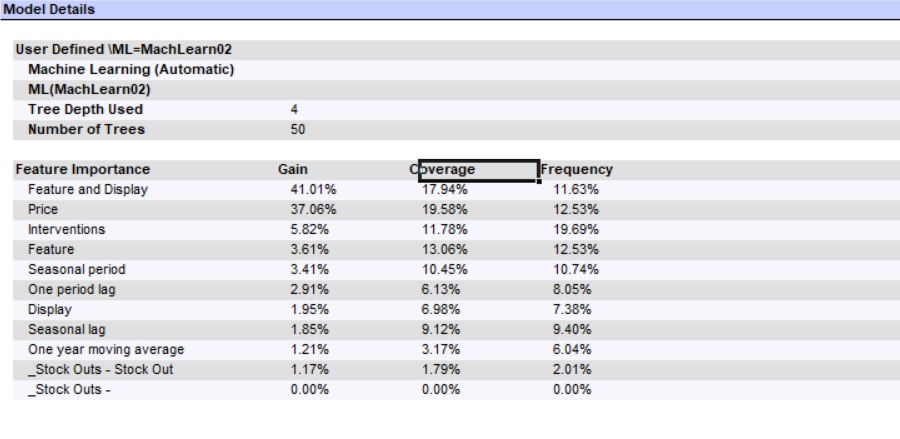
The above Model Details section of the Forecast Report is for a custom model with automatic parameter selection. Forecast Pro has used a maximum tree depth of 4 and 50 trees. The model includes 4 explanatory variables (Price, Feature and Display, Feature, Display) and one Event Schedule (_Stock_outs) with 2 event codes (Stock Out and No Event). The remaining variables were automatically generated by Forecast Pro.
There are three importance measures displayed for each feature: Gain, Coverage and Frequency. Gain measures the percentage of overall model improvement or accuracy that is attributable to a feature. Coverage shows the percentage of observations that are forecasted at a leaf node that are decided by a feature. Frequency is the percentage of tree splits associated with a feature. Gain is widely considered to be the most relevant feature importance measure for forecasting. For more details on feature importance computations, please consult the XGBoost documentation.