Forecast Pro TRAC only
The Mapping Report includes a record of how, when and by whom every mapped history in your project was created. To open the Mapping Report, click the Mapping Report icon on the Reports tab.

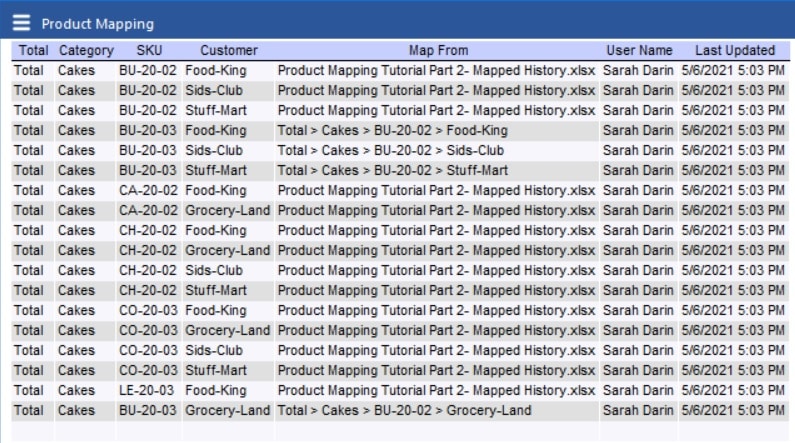
By default, the Mapping Report includes the columns shown above.
In the example shown, the first four columns show the attributes for the Map to items. The number of columns will depend on the number of attributes you have in your hierarchy.
The column labeled Map from shows the Map from item if the mapped history was created with product mapping or the name of the mapped history file, if the mapped history was created by importing a mapped history file. If the forecast history has been set to zero, the field will read “Forecast History set to zero”.
The remaining two columns show the user who created the mapped history and when the mapped history was created.
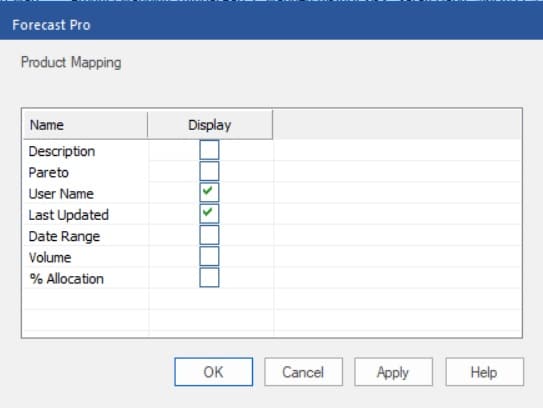
To customize the display, open the Settings dialog from the hamburger menu or the context menu.

The Settings dialog lists all the optional columns you may include in the Mapping Report. User Name and Last Updated are included by default. The remaining optional columns are:
Description: Displays the Description included for the Map to item from the historic data file.
Pareto: Includes four additional columns: Pareto, % of Total, Ranking and Cumulative %. Consult The Pareto Tab for more information.
Date Range: Includes the Start Date, End Date and Periods for the mapped history defined in the Map from column.
Volume: Displays the total unit volume for the mapped history across all mapped periods.
% Allocation: Displays the percentage of the Map From item’s history used to create the mapped history. If a percent allocation was not defined, the value in this column will be blank.

