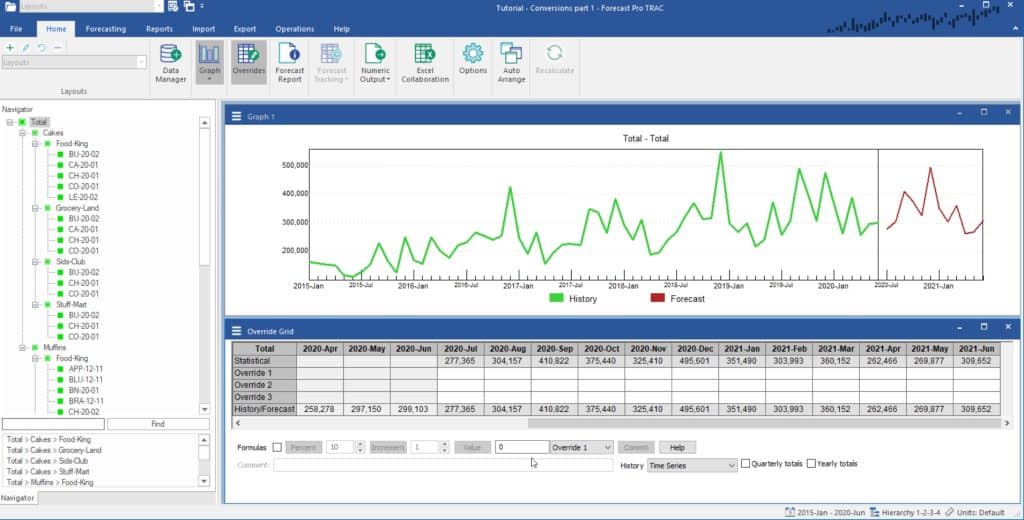
When you set up your data for Forecast Pro, the units of measure you use for the historic demand and the hierarchy that you define are referred to as the default units of measure and the default hierarchy respectively. Together they comprise the default state.
Let’s illustrate this with an example. Start Forecast Pro and open the project Tutorial – Conversions part 1.

This project uses the 123 Bakery data that we have explored in prior lessons. As you may recall, the data were read in from an Excel file called 123 Bakery – Historic Demand.xlsx. The spreadsheet contains sales for the different products measured in cases, making cases our default unit of measure. The spreadsheet also defines the default hierarchy, which in this example has four levels—a total level, a category level (consisting of Cakes and Muffins), a customer level and a SKU level.
The combination of our default units of measure displayed and our default hierarchy is referred to as our default state. Notice that in the lower right-hand corner of the Forecast Pro window, the status bar shows the current (default) hierarchy as “1-2-3-4”, and the current units as “Default”.
Click the right arrow button to proceed.

