It is not uncommon for companies planning production or scheduling to divide the year into twelve periods each consisting of either four or five complete weeks. This is often referred to as a 4-4-5 calendar. In situations where the forecasts ultimately need to be broken down by week, this method may be preferable to using actual calendar months which include partial weeks.
If the number of weeks in each period is consistent from year to year (i.e., period 1 always has 4 weeks, period 2 always has 4 weeks, period 3 always has 5 weeks, etc.) then the variation due to the number of weeks in each period will be captured as part of the seasonality and no special action is required. In cases where the number of weeks in each period varies from year to year (i.e., some years period 1 has 4 weeks other years it has 5) a weighting transformation can be used to capture the variation due to how many weeks are in each period.
The procedure is very straightforward. You construct a weighting variable that classifies each period of the historical data and forecast period as containing either 4 or 5 weeks. Forecast Pro divides the historical data by the weights. (This converts sales per period into sales per week per period.) This deweighted series is forecasted. The forecasts are then reweighted by multiplying by the corresponding weights.
The data for this exercise are contained in two Excel files. 4-4-5 – Historic Data.xls contains five time series that were collected using twelve 4 or 5 week periods per year. The number of weeks per period is not consistent from year to year. 4-4-5 – Helper.xls is a “helper file” and contains the helper variable “Weeks”.
Helper variables can be used as weighting variables, event schedules and analogy series. In this example the helper variable Weeks contains the number of weeks in each period. It covers the historical span as well as the forecast period.
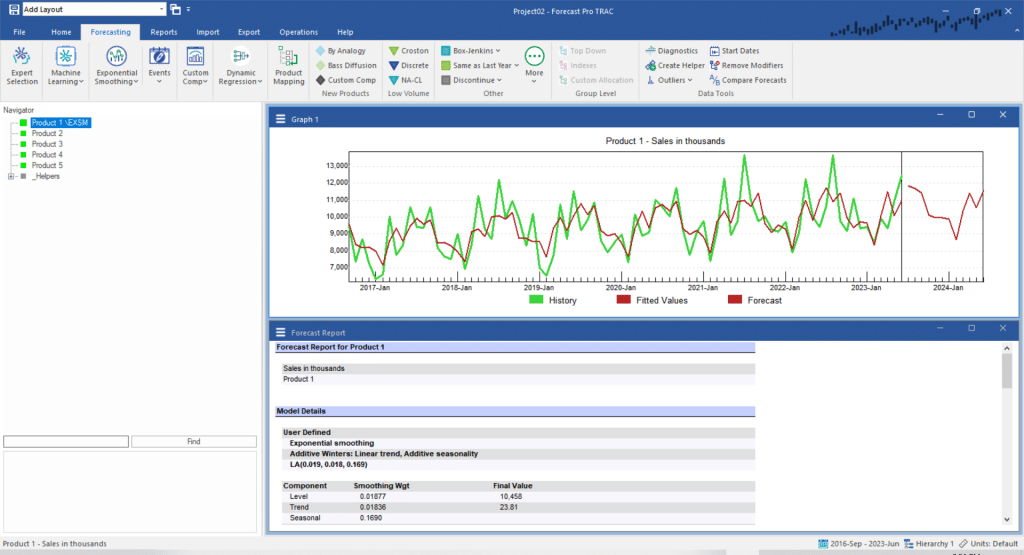
Start the program and open a new project. On the Home tab, click the Data Manager icon, specify 4-4-5 – Historic Data.xls on the Historic Data Row and then specify 4-4-5 – Helpers.xls on the Helpers row. Click the Read & Forecast button, click the Refresh button on the Helpers row and then click Exit to exit the Data Manager. Close the Override view and open the Forecast Report view. Right click the Graph window to invoke its context menu and toggle on Fitted to display the fitted values. Click the Forecasting tab and select Exponential Smoothing. Your screen should now look like the one shown below.

Notice that a seasonal model is selected and that the adjusted R-square is 0.50.
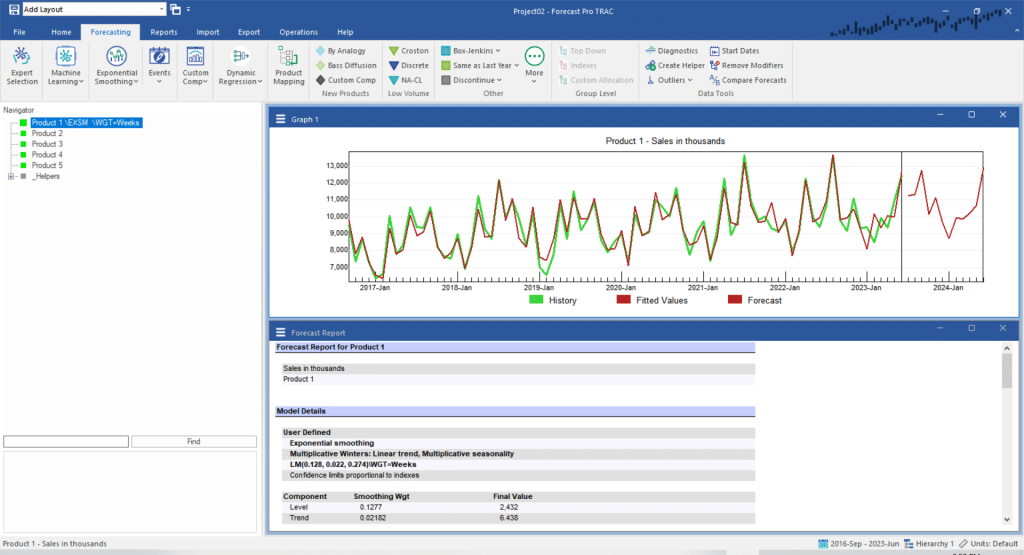
Click the More dropdown in the Other group and select Weights. In the dialog box, select Weeks and click OK.

The second model’s superior fit is easily discernible from a visual inspection of the graph. Notice that a seasonal model is selected and that the adjusted R-square is now 0.91.
Right click on Product 1 to call up the Navigator’s context menu. Select Apply Modifier(s) To>All Items. Since the other four products all use the same calendar, applying the weighting transformation improves the model in all cases.
Exit Forecast Pro.

