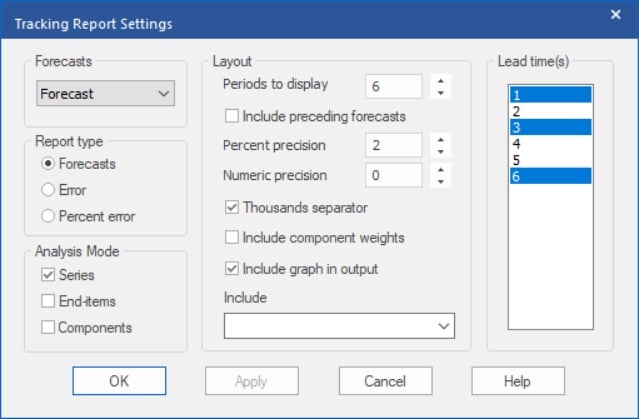
Right click on the Tracking Report to invoke the context menu and select Settings or select Settings from the hamburger menu.

Notice that you can choose to view the statistical, baseline or adjusted forecasts by using the drop-down in the top left of the settings dialog. This allows you to determine if your adjustments are adding value. You can also opt to view the forecasts themselves or the errors or the percent errors.
Select “Percent error” and click the Apply button. Notice that the display is updated accordingly. Check the “Include preceding forecasts” option and click Apply. This will display all archived forecasts that go into the cumulative statistics rather than just the subset in the waterfall display.
The Analysis mode setting controls what cumulative statistics to display for group-level data. The Periods to display spinner controls the number of lead times to include in the report and the Lead time(s) box allows you to specify up to four lead times to color code.
Experiment with the report settings until you are comfortable with their operation. When you are finished, exit the program.
When reviewing tracking reports, you’ll often want to concentrate on items where the forecast accuracy has fallen outside of an acceptable range. Exception reports can be quite useful in this regard and is the subject of the Exception Reporting lesson.
The next lesson on Forecast Value Add (FVA) Reporting helps you understand where your forecasting process is improving accuracy (and where it is not).

