Marked content is Forecast Pro TRAC only

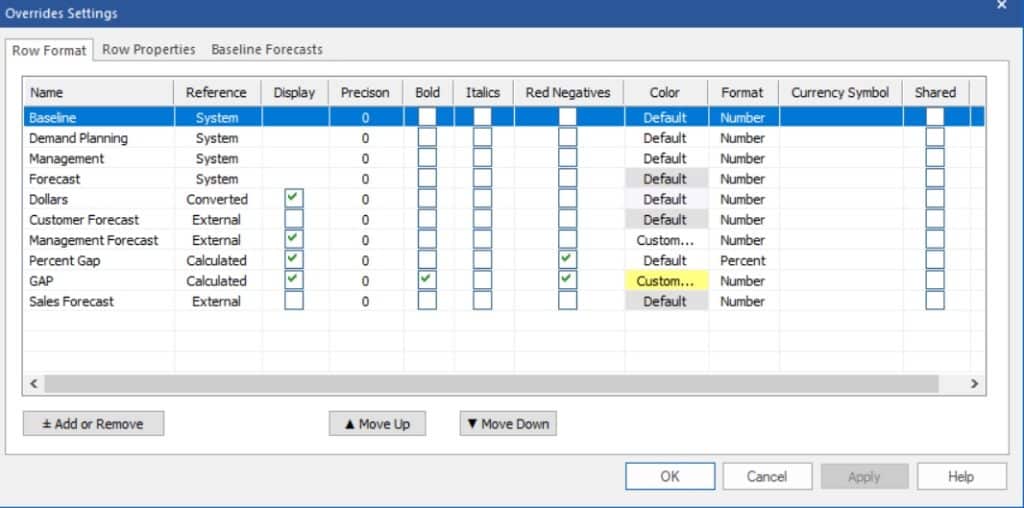
The override grid lets you view and work with different types of rows. The screenshot above displays the Overrides Settings dialog box which lists the currently available rows and lets you customize their appearance. Select Settings on the Override view context menu or select Settings on the view’s hamburger menu to bring up this dialog box. The current screenshot is taken from the project we created in Lesson 3 and includes a range of row types.
History rows, the Baseline row, Override rows and the Forecast row are all standardized rows which always appear in a specific order at the top of the grid. These rows are always displayed on the grid and on the Row Format tab of the Override Settings dialog. The Row Format tab on the Override Settings dialog is also where you control the formatting. Let’s consider each in turn.
History rows: If you select Year over Year on the History drop-down, the grid will display the demand history, by year, prior to the Baseline row. If Mapped History exists, Forecast Pro will display the Forecast History in the Year over Year view, by default. To display actual observed demand history instead, uncheck the Show Forecast History in year-over-year display checkbox on the Overrides tab of the Options dialog. If you select Time Series, the grid will display both History and Forecast in the current Forecast row and relabel it History/Forecast. Forecast History, if it exists, may be displayed in an additional row.
Baseline row: The statistical forecast generated by Forecast Pro is used as the default baseline forecast. (Specifying alternative baseline forecasts is discussed later in this section.) Think of the baseline forecast as the starting point in establishing the final forecast displayed in the Forecast row. If no overrides are made, the final forecast displayed in the Forecast row will equal the Baseline forecast. If you enter overrides, the baseline is adjusted accordingly to establish the final forecast.
Override rows: Operation of the override rows is discussed in detail in Working with overrides.
Forecast row:The Forecast Row displays the current forecast. If Time Series is selected on the History drop-down, this row will be labeled History/Forecast.
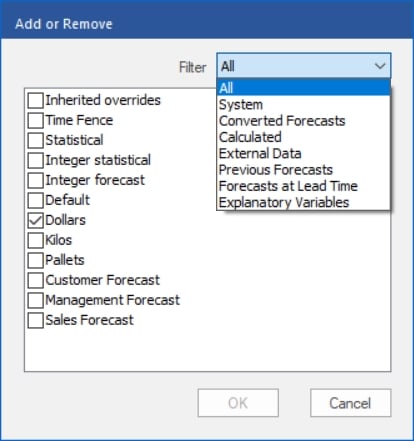
In addition to the standardized row types above, Forecast Pro allows you to add Converted rows, External rows and System rows to the grid. To add these rows, click on the Add or Remove button on the Row Format tab on the Override Settings dialog box to bring up the dialog box shown below.
You can use the filter drop-down to select rows by type or display all rows that may be added to the grid.

[TRAC] Converted rows: Converted rows display the current forecast in different units of measure. If you read in conversion factors in the Data Manager, corresponding converted rows will be available.
[TRAC] External rows: External rows contain numeric information that you have imported using the Data Manager. Common examples of imported external rows are forecasts generated outside of Forecast Pro such as sales forecasts, or management forecasts and product information such as current orders or available inventory.
System rows: The System rows include Inherited Overrides, Time Fence, Statistical and Integer forecasts.
[TRAC] Inherited Overrides are described in detail in the beginning of this section.
[TRAC] Time Fences are described in the Using a Time Fence section of the Forecast Pro Interface chapter.
Statistical contains the statistically based forecast generated by Forecast Pro prior to any overrides being applied.
[TRAC] The Integer forecast displays either the final or baseline forecasts using a special form of rounding that keeps track of the “remainder” (rounded amount) and applies it to the next period’s forecast value. This is particularly useful for low-volume forecasts or when there are large minimum order quantities, where traditional rounding can result in biased forecasts.
Consider a flat forecast of 0.4 units per month for the next 12 months. If you were to use the ROUND() function to round the forecast to the nearest integer the forecast would become, “0, 0, 0, 0, 0, 0, 0, 0, 0, 0, 0, 0”. An integer forecast row for the same forecast would be, “0, 1, 0, 1, 0, 0, 1, 0, 1, 0, 0, 1”. Integer forecast settings are defined in the Advanced Control tab of the Options dialog box.
[TRAC] Previous Forecasts: Previous forecasts, a specific type of system row that you can filter on in the Add or Remove dialog box, are simply forecasts that were generated in prior forecast cycles (i.e., that you created in the past and are stored in the Forecast Pro data base). Previous forecasts are useful for tracking how forecasts change from one forecast cycle to the next and measuring forecast accuracy. Forecast Pro archives final forecasts, statistical forecasts and baselined forecasts. These archived forecasts are named “Previous Forecast #”, “Previous Statistical #” and “Previous Baseline #”, where ‘#’ indicates when the forecast was archived. For example, “Previous Forecast 1” displays the final forecasts generated one period ago, while “Previous Statistical 2” displays the statistical forecasts generated 2 months ago. Forecast Pro will display all archived periods available in the database in the Add or Remove dialog box.
[TRAC] Forecasts at Lead Time: Another type of system row, Forecasts at lead time are useful for tracking forecast changes and accuracy for specific lead times. A lead time refers to the number of periods ahead of the forecast origin (the period when the forecast was established) the forecast was made for. Thus, a one-month-ahead forecast would have lead time equals 1, a two-month-ahead forecast would have lead time equals 2, etc.
You can also create Calculated rows and Blank rows in the overrides grid.
[TRAC] Calculated rows: Calculated rows allow you to enter formulas using other rows, arithmetic operators and predefined “tokens” (key words). Calculated rows are inserted into the grid by selecting the Forecast row (or any row underneath it), right clicking to invoke the context menu or using the Hamburger menu in the top left of the view and selecting Add row.
[TRAC] Selecting Add row opens a dialog box where you name the calculated row and specify the scope of the calculated row. Calculated rows may be Global or Item-specific. A Global calculated row applies the same row entries and formulas to all items in the hierarchy or all items in a designated level of the hierarchy. The hierarchy level is determined by the item that is selected in the Navigator when the Global calculated row is created. You can also define the hierarchy level for a Global calculated row when you define row properties. An item-specific calculated row only applies to the selected item. If you enter a formula in an item-specific row, that formula will not be shown for any other item.
Once added, a calculated row can be added or removed from the Row Format tab on the Overrides Settings dialog box using the Add or Remove button, as described above. The next section discusses how to enter the formulas and details the supported operators and tokens.
[TRAC] Blank rows: Blank rows can be added to the grid to enhance readability. They are inserted in a similar fashion to calculated rows. To insert a blank row, select the Forecast row (or any row underneath it) and select Add row on the context menu or hamburger menu. A dialog box will appear allowing you to name the row. If you enter a name and click OK, the row will be inserted as a calculated row, but if you erase the default name and click OK (i.e., process a blank input field) the row will be inserted as a blank row.

