Forecast Pro TRAC only

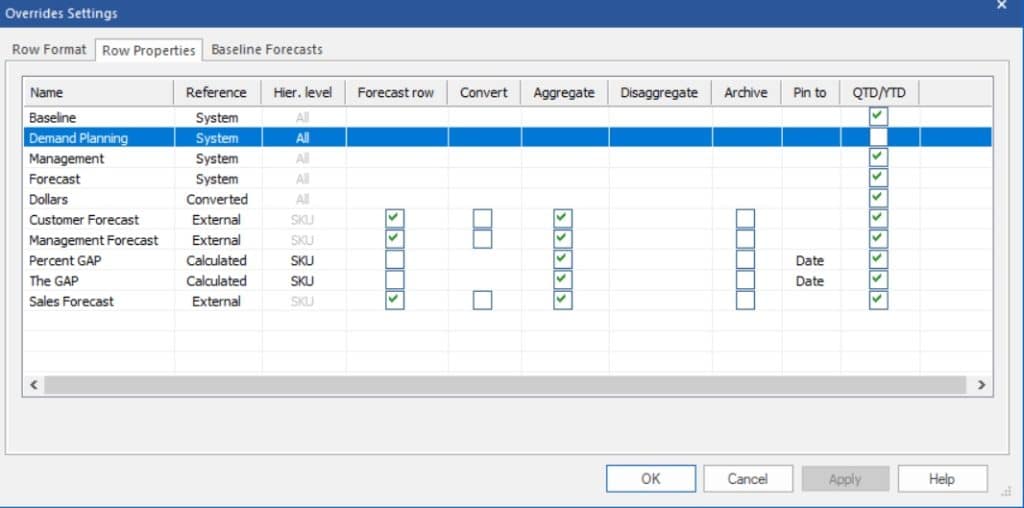
The Row Properties tab on the Overrides Settings dialog box allows you to control how certain grid values are calculated and displayed.
The Hier. level column displays the level at which the data are defined. For Converted rows this will always be the lowest level since the conversion factors can only be defined at the lowest level. For External rows, this column displays the level at which the data were imported. For Global Calculated rows, this column is a drop-down which allows to specify the level to calculate the formulas or to specify that the formulas should be calculated independently (as opposed to using aggregation/disaggregation) at all levels. For Item-specific Calculated rows, the drop-down will show All and cannot be changed, since entries for item-specific calculated rows may be entered for any item in the hierarchy.
The Forecast row column allows you to indicate whether the row should be treated as a forecast row. This is important, since only forecast rows can be assigned as baseline forecasts.
The Convert column allows you to indicate whether the row should convert to different units when you change the Units displayed in Forecast Pro.
The Aggregate column allows you to indicate whether External rows and Calculated rows should display aggregated group totals for levels above the Hier. Level.
The Disaggregate column allows you to indicate whether External rows and Calculated rows should display disaggregated values for levels below the Hier. Level.
The Archive column is used to indicate whether the row should be archived in the Forecast Pro database for every forecast origin. This is only recommended if you have a specific need for this information to be stored within your Forecast Pro project.
The Pin to column is used to control where a formula will appear after you update your historic data and generate a new forecast from a different forecast origin. If you select Date the formula will be tied to the specific date for which it was originally entered. If you select Column the formula will be tied to the column position for which it was originally entered and it’s position will not change when the historic data is updated.
For example, suppose you originally generate a 12-month forecast and the first forecast period is July 2021, so the grid displays 12 columns for the forecasts covering the span of July 2021 through June 2022. You create a calculated row and enter a formula in the 12th column (which corresponds to June 2022). Next month, you update your historic demand, re-forecast the project and the grid now displays 12 new forecasts covering the span from August 2021 through July 2021. Where does the formula you entered last month appear in the updated override grid? If you selected Pin to Date, the formula appears in the 11th column of the display (which now corresponds to June 2022) and the 12th column (which now corresponds to July 2022) will be blank. If you selected Pin to Column, the formula appears in the 12th column of the display (which now corresponds to July 2022).

