Forecast Pro TRAC only
Click on the Waterfall icon on the Reports tab to open the Waterfall report.
The Waterfall report provides a complete summary of forecast accuracy across a specified lead time. It doesn’t compare items and calculate deviations like the other exception reports. It simply allows you to list statistics from the waterfall reports in a global report that can be sorted and filtered to aid in your review process.

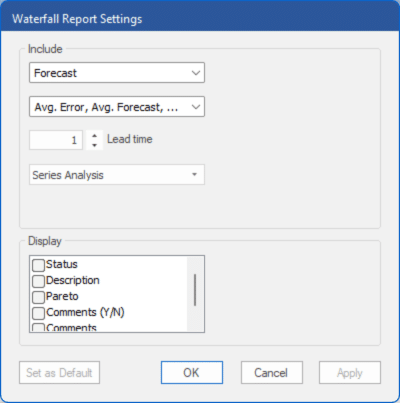
The Display section is used to define what to show in the report. The top drop-down (currently showing Forecast) is used to select which forecasts (Forecast, Baseline and/or Statistical) to include in the report. The drop-down below that is used to select which statistics (Avg. Error, Avg. Forecast and Avg. Perc. Error) to include as additional columns in the report. The Lead time spinner is used to select the lead time for the report. The bottom drop-down in the Display section lets you choose the analysis type (Series, End Item-level or Component). Please see The Tracking Report and Tracking Report Graph Views in this chapter for more details on lead times and analysis types.
The Display section lists the optional columns you may include in the report.
- Status: Displays the status.
- Status Assigned By: Displays the user who assigned the status.
- Status Assigned Date: Displays the date the status was assigned.
- Last Viewed By: Displays the user who last viewed the item.
- Last Viewed Date: Displays the date the item was last viewed.
- Description: Displays the Description for the item in the historic data file.
- Pareto: Includes four additional columns: Pareto, % of Total, Ranking and Cumulative %. Consult The Pareto Tab for more information.
- Comments (Y/N): Displays a value of Yes or No to identify which items have item-level comments associated with them.
- Comments: Displays the most recent comment.
- Custom Filters: If you have included filters in the project (see Custom Filter Fields in Setting Up Your Optional Data), you may add those to the report.

