Forecast Pro TRAC only
Forecast Value Add (FVA) reports display the accuracy and value-add of each step in your forecasting process for the prior forecasting period. For each process step, you can compare the forecast accuracy to the forecast accuracy for an earlier stage or step in your forecasting process. For example, you can compare the accuracy of an override made in the review stage to the baseline forecast accuracy. Please see The Forecast Value Add (FVA) View for more details on FVA analysis.
Click on the FVA Global icon on the Reports tab to open the FVA Global report. Select Settings from the hamburger or context menu to customize your view.

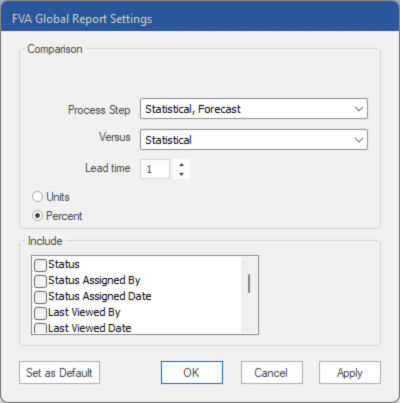
The Comparison section is used to define what to show in the report. If the checkbox Last period’s forecast versus statistical is checked, the report will include only the final forecast compared to the statistical forecast. This is checked by default. If checked, the Lead Time spinner, Process Steps and Versus drop-downs are not available.
- Process Steps: Use this drop-down to select which process steps you want to include as rows in your report.
- Versus: Use this drop-down to select which process steps/forecasts you want to include as comparison columns. For example, you would select Statistical to include a “FVA vs. Statistical” column.
- Lead time: Use this spinner to select which lead time you want to use. A lead time refers to the number of periods ahead of the forecast origin (the period when the forecast is generated) the forecast was made for. Thus, a one-month-ahead forecast would have lead time equals 1, a two-month-ahead forecast would have lead time equals 2, etc.
- Units/Percent: Use this radio button to specify how you want to measure Forecast Error.
The Display section lists the optional columns you may include in the report.
- Status: Displays the status.
- Status Assigned By: Displays the user who assigned the status.
- Status Assigned Date: Displays the date the status was assigned.
- Last Viewed By: Displays the user who last viewed the item.
- Last Viewed Date: Displays the date the item was last viewed.
- Description: Displays the Description for the item in the historic data file.
- Pareto: Includes four additional columns: Pareto, % of Total, Ranking and Cumulative %. Consult The Pareto Tab for more information.
- Comments (Y/N): Displays a value of Yes or No to identify which items have item-level comments associated with them.
- Comments: Displays the most recent comment.
- Custom Filters: If you have included filters in the project (see Custom Filter Fields in Setting Up Your Optional Data), you may add those to the report.

