Forecast Pro TRAC only
The Exception Report views enable you to quickly find cases where your forecast error or some other performance metric has fallen outside of an acceptable range. Exception reporting reduces the need for manual review of your forecasts and allows you to focus on the items where human attention is most needed.
Forecast Pro provides a wide array of exception reports, some of which monitor the current forecasts and others which monitor your archived forecasts. The available Exception Report views are shown on the Reports tab.

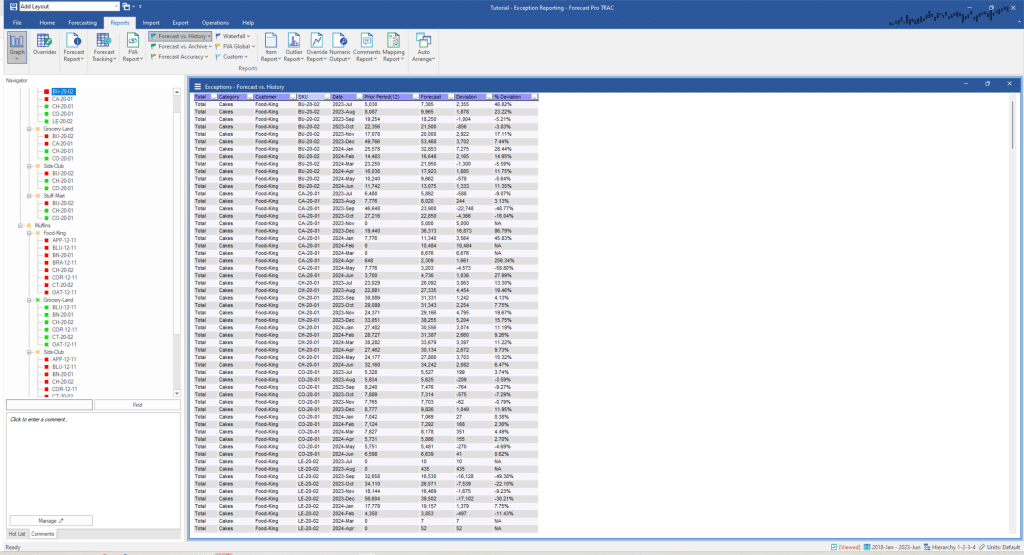
All exception reports are displayed in a format like the example shown below. A row is included for every item in the hierarchy. The items can be filtered to show only items that need further examination, as described below. Select Filters on the hamburger menu in the upper left-hand corner of the view or on the view’s context menu to activate the filtering capability.

The initial columns identify the item. This is followed by a Date column identifying the exception period. The next two columns display the value being monitored and what it is being monitored against. This is followed by a Deviation column showing the difference and the %Deviation column showing the difference as a percent.
Double-clicking an item on an exception report will cause the Navigator to jump directly to that item. Thus, you can use the exception report as the equivalent of a Hot List to navigate through the listed items. All of the global report views support this kind of navigation.
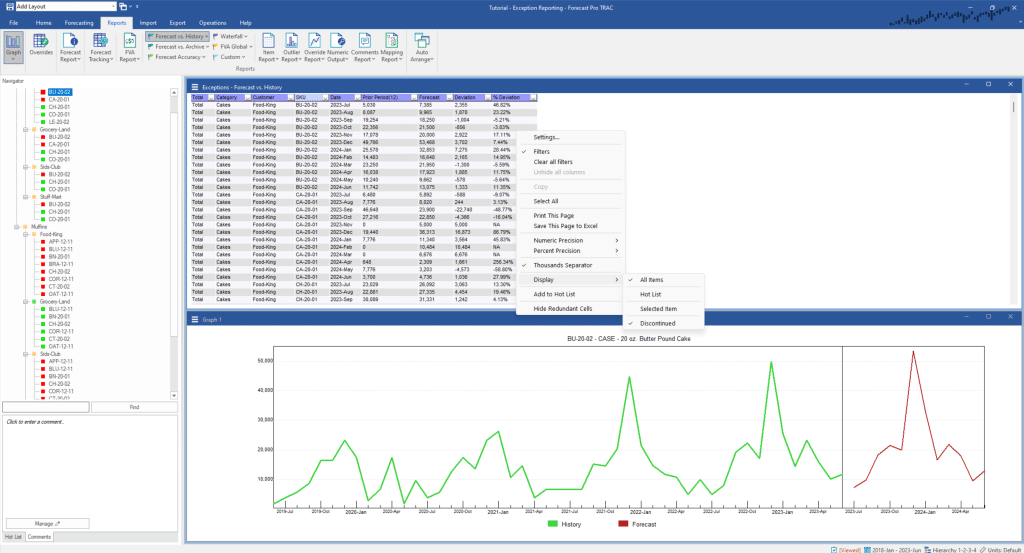
Right clicking on the Exception Report view brings up the Exception Report context menu, or alternatively you can use the Hamburger menu in the top left corner of the view.

Hover over Display and you can select All Items, Hot List or Selected Item to quickly adjust which items should be included in the report. You can also remove Discontinued items from the report.
Exception reports are best used in conjunction with Filters and Layouts. Please refer to the Exception Reporting lesson in Forecast Pro TRAC Tutorials or the View Window section in this manual for an overview of how to use Filters and Layouts with Exception reports.
The content and format of the Exception Report is controlled using the Exception Report Settings dialog box. This dialog box is invoked by selecting Settings on the hamburger menu or from the Exception Report view’s context menu. You may also use the Settings drop-down icon on the Reports tab for one of the six exception reports to open settings for the selected exceptions report.

