Forecast Pro TRAC only
Click on the Custom icon on the Reports tab to open the Custom report. The Custom report compares the current forecast or history to any row(s) available in the override grid.

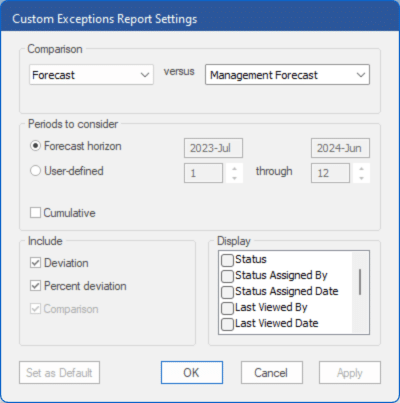
The report shown above (taken from the project Lesson 10) compares the current forecast to the Sales Forecast (an external row). The Comparison drop-down menus allow you to select if you want to compare history or a forecast (forecast, baseline or statistical) and the comparison series.
The Periods to consider section allows you to select how many time periods to monitor). Select User-defined to activate the spinners below the date range. Use the spinners to select the starting and ending historic periods. Selecting “1” or “0” will select the most recent historic period, “-1” will select the previous historic period and so on. As you change the spinners, the date above will update to reflect the actual starting and ending periods selected. Check Cumulative if you want to look at the total across the specified historical periods.
The Include section allows you to specify which statistics you want to show in the report.
The Display section lists the optional columns you may include in the report.
- Status: Displays the status.
- Status Assigned By: Displays the user who assigned the status.
- Status Assigned Date: Displays the date the status was assigned.
- Last Viewed By: Displays the user who last viewed the item.
- Last Viewed Date: Displays the date the item was last viewed.
- Description: Displays the Description for the item in the historic data file.
- Pareto: Includes four additional columns: Pareto, % of Total, Ranking and Cumulative %. Consult The Pareto Tab for more information.
- Comments (Y/N): Displays a value of Yes or No to identify which items have item-level comments associated with them.
- Comments: Displays the most recent comment.
- Custom Filters: If you have included filters in the project (see Custom Filter Fields in Setting Up Your Optional Data), you may add those to the report.

