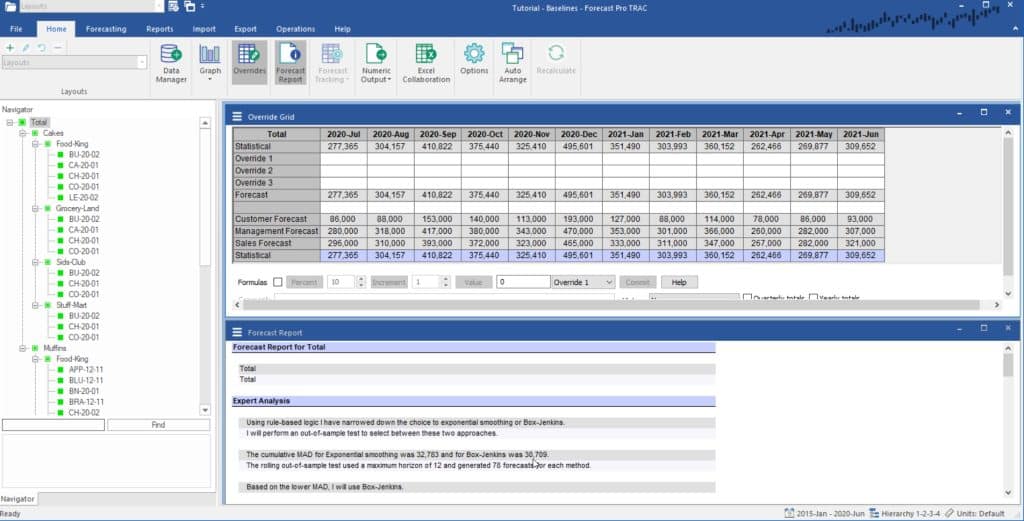
Start Forecast Pro, select Open and open the project, Tutorial – Baselines. This project contains forecasts for the cakes and muffins data that we worked with in previous lessons.

The Override view includes rows displaying a Management Forecast, a Sales Forecast and a Customer Forecast. These external forecasts were generated outside of Forecast Pro, imported using the Data Manager and added to the Override Grid using the Add or Remove button on the Overrides Settings dialog box. Notice there are also two rows displaying the Statistical forecast. One is being used for the baseline and the other was added to the display using the Overrides Settings dialog box.
Select Total>Cakes>Food-King>BU-20-02 on the Navigator. Let’s say that for this item rather than using the Statistical forecast as our baseline, we want to use the forecast supplied by our customer. To accomplish this, select the Customer Forecast row by clicking on the row label, then right click to invoke the context menu and select Set as Baseline. Notice that the first Statistical forecast row has been replaced by the Customer Forecast row and the Forecast row reflects the change in the baseline.
Select Total> Cakes>Food-King>CA-20-01 on the Navigator. Let’s say that for this item rather than using the Statistical forecast as our baseline, we want to use the forecast supplied by management. To accomplish this, select the Management Forecast row by clicking on the row label, right mouse click to invoke the context menu and select Set as Baseline. Notice that the first Statistical forecast row has been replaced by the Management Forecast row and the Forecast row reflects the change in the baseline.
Select Total>Cakes>Grocery-Land. Notice that the baseline row (first row on the current display) is labeled “Statistical.” Select Total>Cake>Food-King. Notice that the baseline row (first row on the current display) is labeled “Baseline,” since we’ve specified alternative baseline forecasts for some of the SKUs that comprise this group.
Forecast Pro allows you to specify alternative baseline forecasts at the end-item level (i.e., lowest level of your hierarchy). When you do so, any higher-level groups’ baseline forecasts will be the aggregate of the lower-level baselines.

