Marked content is Forecast Pro TRAC only
The Data Manager provides a centralized place to define all input data for Forecast Pro and keep it up to date. You invoke the Data Manager by clicking the Data Manager icon on the Home tab.

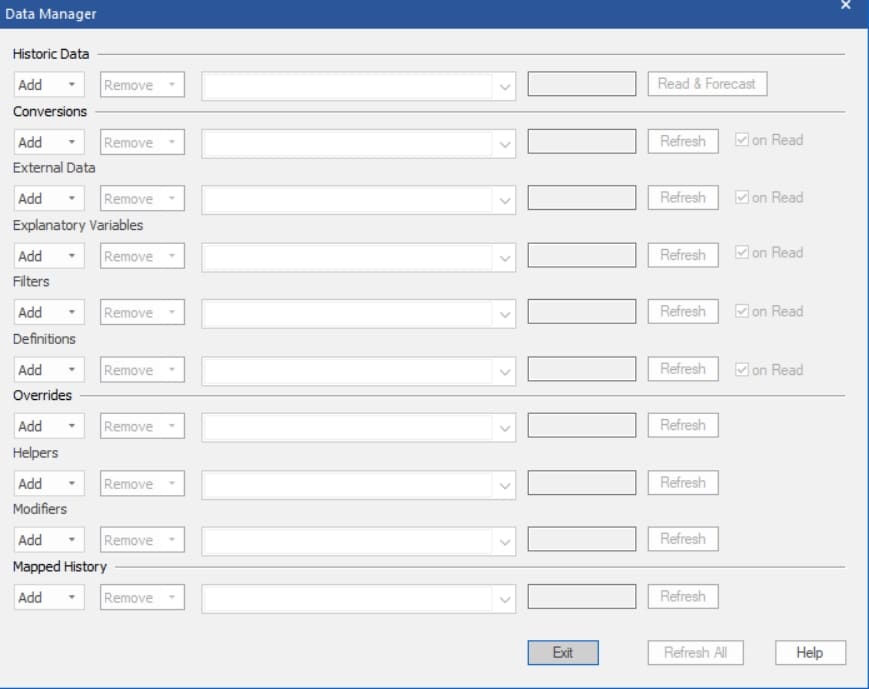
The Data Manger consists of ten rows, each of which allows you to read in a different type of data.
In addition to the Historic Data (which is required), Forecast Pro’s Data Manager allows you to import other information to assist you in creating and working with the forecasts. Specifically, you can import:
[TRAC] Conversions Factors: Conversion factors allow you to display the history and forecasts in alternative units of measure (e.g., dollars, kilos, etc.). Consult Conversion Factors for details.
[TRAC] External Data: Forecast Pro allows you to import external data rows (such as alternative forecasts, open orders, etc.) into the forecast override grid. External Data provides setup details.
Explanatory Variables: Variables that you may wish to include in a dynamic regression model may be read in with an explanatory variable file. Explanatory Variables provides details.
[TRAC] Filters: Filter fields can be included in report views and filtered like any other fields. They can also be included in the numeric output file. Custom Filter Fields provides details.
Definitions: Definition files contain values to use in conjunction with custom forecast allocations and item-level integer rounding quantities. Consult Definitions: Custom Allocations and Definitions: Integer Rounding Quantities for details.
Overrides: In addition to entering forecast overrides interactively using the Forecast Overrides view, Forecast Pro allows you to import them. Consult Override Files for details.
Helpers: Helper variables are used in conjunction with event models, forecast by analogy models and weighting transformations. Helper Files provides details.
Modifiers. In addition to specifying forecast modifiers interactively on the Navigator, Forecast Pro allows you to import them. Modifier Files provides details.
[TRAC] Mapped History: Product Mapping and Mapped History files are used to create Forecast Histories, which equal the Mapped History, if it exists, plus the actual histories in the Historic Data files. Product Mapping and Mapped History files are useful for item supersession and new/replacement products. See Mapping Files for details.
Row Controls
Each row has controls associated with it that allow you to specify data sources, remove data sources and read the data.
Add drop-down: The Add drop-down is used to select data sources. You first specify the type of data source you will be adding (Excel, MLT or ODBC) and then the program will prompt you to specify the file, table or query. The Overrides, Helpers and Modifiers rows also allow you to specify a Forecast Pro project as the data source. If you wish to specify multiple data sources for a given row, you may. The first time you add an ODBC data source you will be prompted to choose an ODBC driver and connect to the database. Note that you can only read from one ODBC connection at a time.

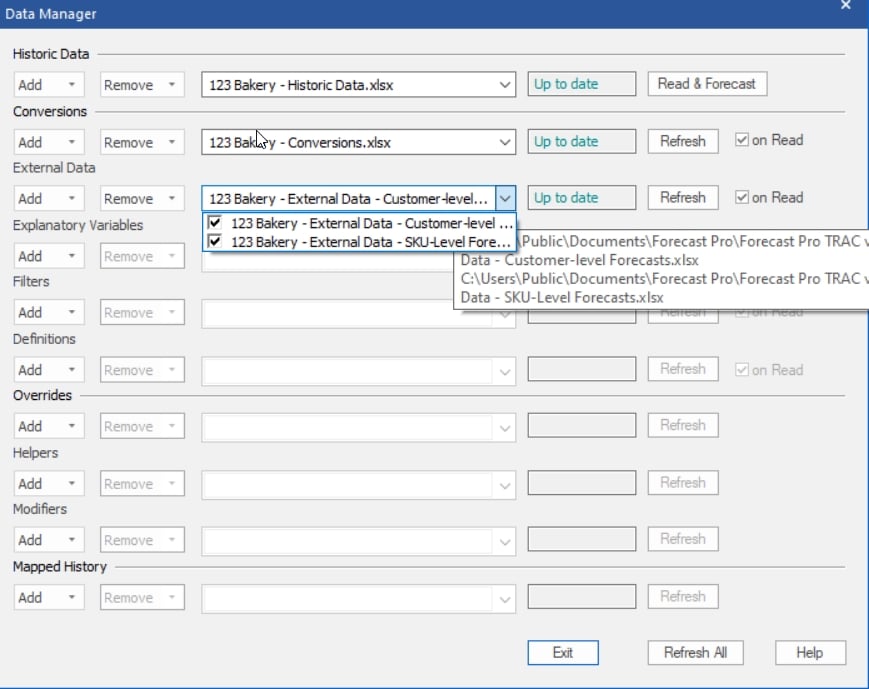
Selected data sources drop-down: After you add one or more data sources to a given row, the filenames, table names, query names, or project names will appear on the selected data sources drop-down display. If you open this drop-down, you will see a list of the selected data sources along with a checkbox to the left of each one. This check box is used to mark the source as active or inactive. When you read the data, only the active data sources will be read.
Remove drop-down: The remove drop-down is used to remove data sources from the row. You have the option of either removing all specified data sources or only the inactive (unchecked) ones. After you use the Remove drop-down you will need to refresh the row to delete the data from the current project.
Status box: The status box displays the current status for the data sources specified on the row. “Refresh pending” means that the current row specifications do not match the project’s current state and you need to refresh the row to sync them with the project.
Read & Forecast button: The Historic Data row includes a button labeled Read & Forecast. Clicking the button will read in the historic data and generate the forecasts. It will also refresh (i.e., read or re-read) any data rows where the “on read” option is selected.
Refresh button: The Refresh button is used to read (or re-read) the data for the specified row.
On Read checkbox: Five of the rows include an on Read checkbox. If this option is selected Forecast Pro will automatically refresh the row whenever you read in the historic data. The on Read option is useful when the associated data will be changing each forecast period.
Notice that the Overrides, Helpers, Modifiers and Mapped History rows do not have on Read options and therefore can only be refreshed by clicking their Refresh buttons (or clicking Refresh All). This is because overrides, modifiers, helper variables and mapped histories can all be modified interactively using Forecast Pro, and therefore refreshing them automatically from the data source may have unintended consequences (e.g., overriding your manual changes, etc.)
Refresh All button: The Refresh All button will refresh all data rows.

