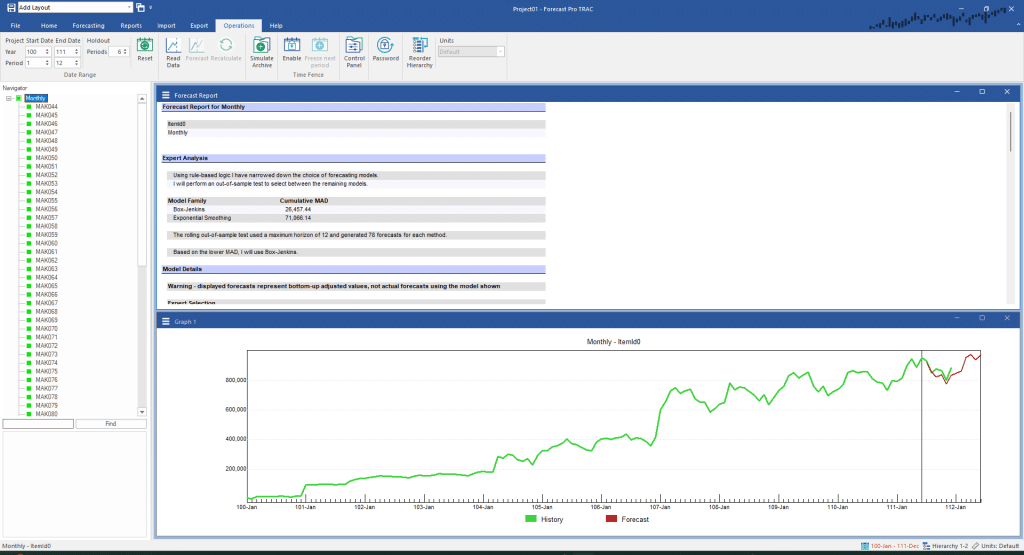
Select the group Monthly on the Navigator and scroll the Forecast Report so you can see the Out-of-Sample Rolling Evaluation for Items in Group section of the Forecast Report view.

The tables display the following information. Means are always taken over all the variables forecasted for a particular display line.
Hor is the forecast horizon.
N is the number of cases used to compute all statistics for this horizon other than the MAPE (see below).
MAPE N is the number of cases used to compute the MAPEs for this horizon. This can be less than the total number of forecasts for the horizon when some of the actuals are zero, thus preventing computation of the MAPE.
MAD is the Mean Absolute Deviation for the horizon, over all series on the current display line.
Cumulative MAD is the cumulative MAD for all horizons up to and including the current horizon.
MAPE is the Mean Absolute Percentage Error for the horizon, over all series on the current display line.
Cumulative MAPE is the cumulative MAPE for all horizons up to and including the current horizon.
Below Upper Limit is the fraction of times that the actual was at or below the upper confidence limit as set in Settings Options. This allows you to calibrate the empirical upper limit to the theoretical upper limit. This is useful when you are using the upper limit to set stocking levels.
Advanced statistics such as Mad/Mean ratio, Symmetric MAPE and the Geometric Mean Relative Absolute Error can also be displayed if you customize the Forecast eport.
Figures listed in the row below the last forecast horizon refer to all horizons. Each group on the Navigator will produce such a report.

