(This section is a continuation of Custom Component Model for New Products)
When working with items that have less than one year’s worth of historic demand, Forecast Pro is not able to automatically build seasonal models. Thus, if you have items with less than one year’s worth of history that you know are seasonal, you will need to customize your forecasting approach.
The Auto Parts dataset includes many seasonal items that have less than one year’s worth of data. In this section we will explore some of the tools available in Forecast Pro to identify and manage these types of items.
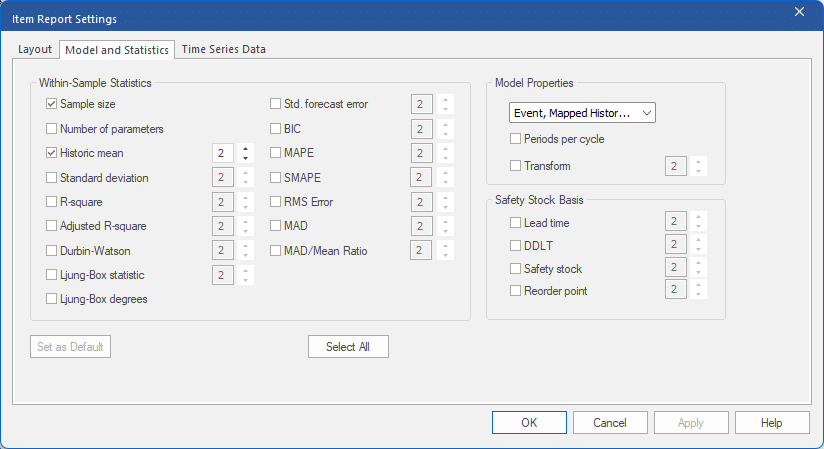
Close the Graph and Forecast Report views. Select the Reports tab and click the Item Report icon. Click on the Auto Arrange icon to maximize the Forecast Report view. Click on the hamburger menu in the upper left corner of the view and select Settings. Select the Model and Statistics tab.

This tab displays information that you can add to the Item Report. In the Within-Sample Statistics section, notice that “Sample size” is selected. This corresponds to the “N” column on the report and displays the number of historic data points for each item. Click OK to close the dialog box.
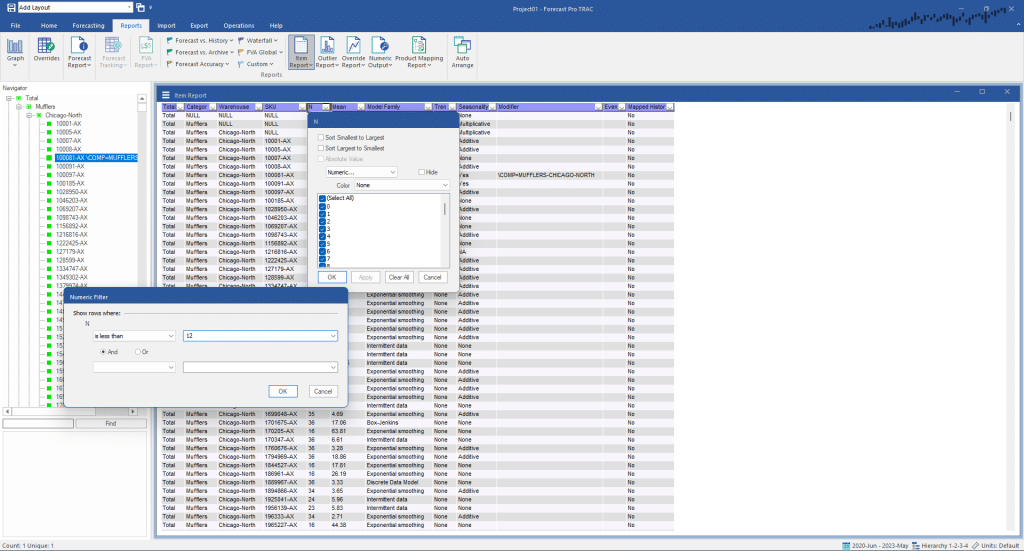
Suppose we want to look at only items with less than one year of history. On the hamburger menu, select Filters. Click the arrow on the “N” column to open the dialog below.

Open the Numeric drop-down and select Numeric to open the Numeric Filter dialog. In the top left drop-down list, select is less than and enter 12 in the combo box to the right. Click OK to close the Numeric Filter dialog and then Click OK to close the Filter dialog.

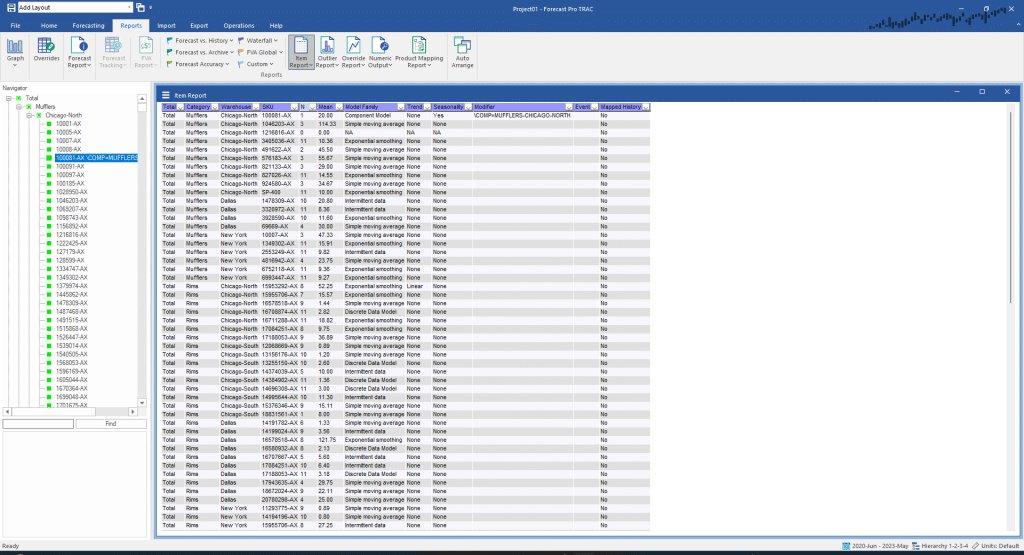
The Item Report now shows only items with less than 12 months of history.
Now suppose we want to apply our custom component model, “Mufflers-Chicago-North” to all new Muffler SKUs in Chicago-North. Click the arrow on the Category filter, remove the check next to “Select All” and then Select Mufflers. Click OK. Now filter the Warehouse column to only include Chicago-North. The display now shows all Mufflers SKUs in Chicago-North that have less than 12 months of demand history.
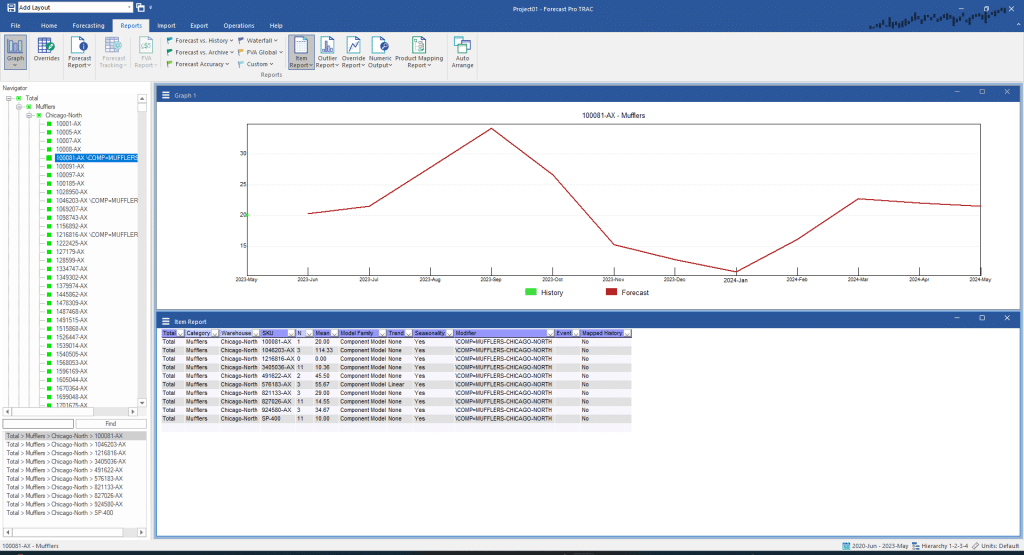
Open a Graph view and click the Auto Arrange icon to tile the views. Double click on a few items on the Item Report and note that with the exception of Total>Mufflers>Chicago-North>10081-AX (where we built a custom component model) all the SKUs show a flat, non-seasonal forecast. Right click on the Item Report to bring up the Item Report context menu and select Add to Hotlist.
To apply the “Mufflers-Chicago-North” model to all items on the hot list, scroll to the top of the Navigator, right click on Total>Mufflers>Chicago-North>100081-AX and select Apply Modifier to>Hotlist on the context menu. Note that the Item Report is now indicating that a custom component model is being used for all of the filtered items. Double click on a few items in the Item Report to view the now seasonal forecasts.

If this were a real forecasting session, we would proceed to handle the remaining new products in a similar fashion.
Exit Forecast Pro.
This concludes the New Product Forecasting tutorial.

