In this exercise we’ll create forecasts for a new product using a technique known as forecast by analogy. This approach is sometimes also referred to as “looks like” analysis.
The concept is a very simple one. You are launching a new product and you expect the initial sales pattern to be similar to an analogous product’s initial sales pattern or to a “launch profile” that you’ve created. To use this method, you must supply the launch profile or “analog series” in the form of a helper variable. Helper variables are used in conjunction with event models, forecast by analogy models and weighting transformations.
If the product has not yet launched (i.e., there are no historic data available) then you must also supply an estimate of the initial sales over a specific period of time (the “launch total” over the “launch horizon”). Forecast Pro will then create the forecast by proportionally allocating the launch total over the launch horizon using the analog series to define the proportions.
If any historic demand for the new product is available, you may either supply the launch total and launch horizon or allow Forecast Pro to calculate the forecasts by fitting the existing data to the analog series.
In this exercise, we will look at two examples—one where no data are available for the new product and the other where the initial 3 months of sales are known.
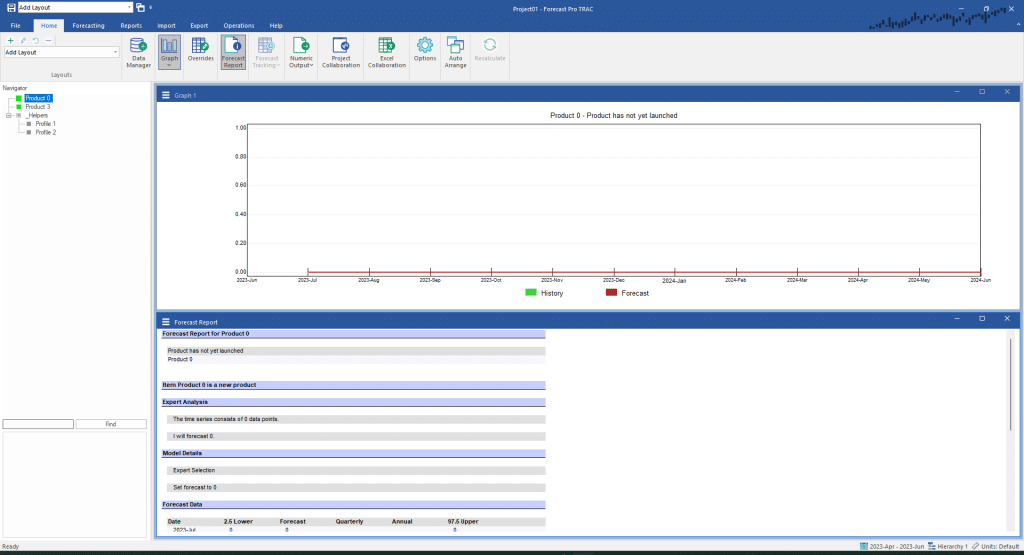
Start the program and click the New Project icon. From the Home tab, open the Data Manager and specify New Product- Historic Data.xlsx on the Historic Data Row and New Product- Helpers.xlsx on the Helpers row. Click the Read & Forecast button, click the Refresh button on the Helpers row and then click Exit to exit the Data Manager. Close the Override view, open the Forecast Report view and fully expand the Navigator by right clicking on the Navigator to bring up the context menu and selecting Expand All. Your screen should now look like the one shown below.
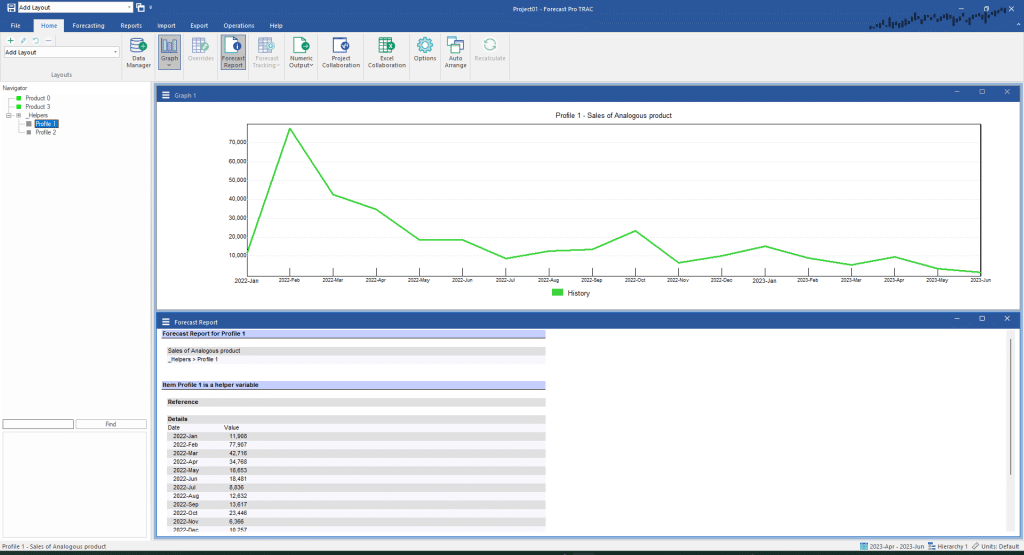
We have read in two launch profiles from New Product- Helpers.xlsx that we may use as analog variables, Profile 1 and Profile 2. Each of these profiles contains the initial year and a half of monthly sales for a prior new product launch. Sales for our new product are likely to follow the same initial sales pattern as the product sales shown in Profile 1. Click on Profile 1 to display the graph.
Select Product-0 on the Navigator and then go to the Forecasting tab. Click the By Analogy icon in the New Products group to invoke the dialog box shown below.
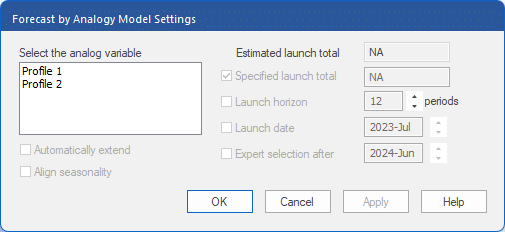
We must begin by selecting the analog variable to use. In our example there are two available. Select Profile 1 by clicking it. Since Product-0 does not contain any historic demand, a launch total must be specified. The default value for the Specified launch total is to calculate it using the values specified in the analog variable—in our example this yields 279,587. Let’s say that our market research leads us to believe that this new product will sell 500,000 units in the first 12 months. To have our forecast reflect this assumption, edit the Specified launch total to equal 500000. Check the boxes for Launch horizon and Launch date. Notice that the default Launch horizon is set to 12 (the length of the data plus the forecast horizon) and that the default Launch date is July 2023 (the first forecast point). Click Apply to build the model and OK to exit the dialog box.
Examine the output. Notice that the forecast now reflects the shape of the analog variable and Total forecast equals 500,000.
Now we will use the forecast by analogy method to prepare forecasts for the same product after we have 3 months’ worth of history.
Select Product-3 on the Navigator and click the By Analogy icon in the New Products group on the Forecasting tab. Select Profile 1 as the analog variable by clicking on it. Select Launch horizon and set the number of periods to 12. The dialog box should now look like the one below.
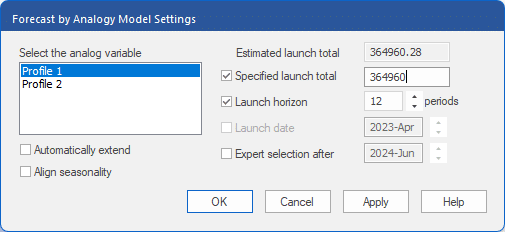
Now that we have some historic data, Forecast Pro can fit the Analog model and calculate the estimated launch total from the historic demand. The estimated launch total predicts that at our current rate, we will sell 364,960 units during the Launch horizon (the first 12 months in our example).
This is substantially less than the 500,000 units our market research predicted. Select Specified launch total and set it to 500000. Click Apply to build the model and OK to exit the dialog box. Right click the Graph window to invoke its context menu and toggle on Fitted to display the fitted values.
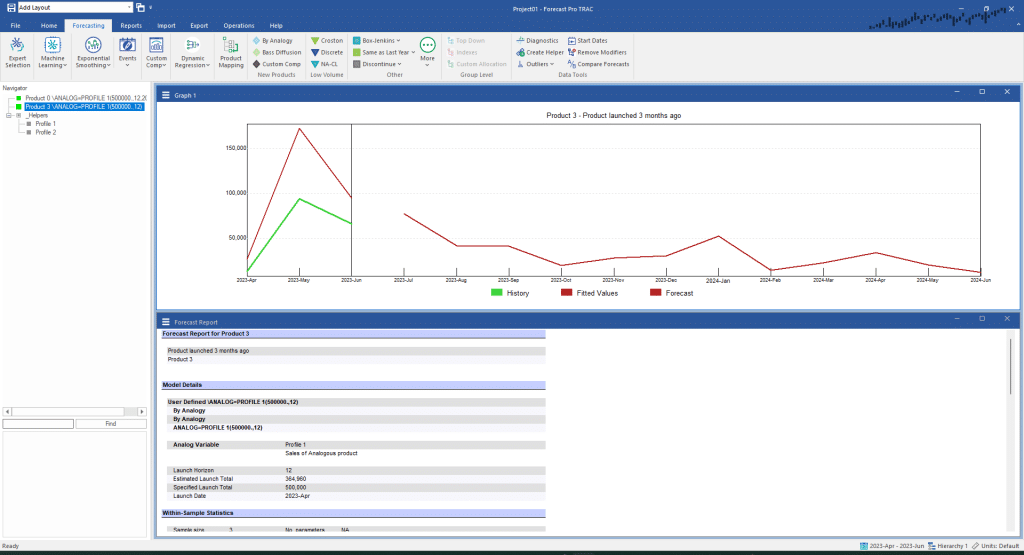
The forecast shows the sales now required to achieve the specified launch total. The fit shows the historic volume that would normally be associated with the current forecast. The green line shows the actual sales to date—which in this example is substantially lower than the fit.
Click the By Analogy icon on the Forecasting tab return to the Forecast by Analogy dialog box. Remove the check mark from the Specified launch total option and click OK to build the model using the estimated launch total and exit the dialog box.
This ability to compare your specified launch totals with the estimated launch totals is quite powerful and will often illustrate the need to revisit your assumptions as the actual demand comes in.
Exit Forecast Pro.

