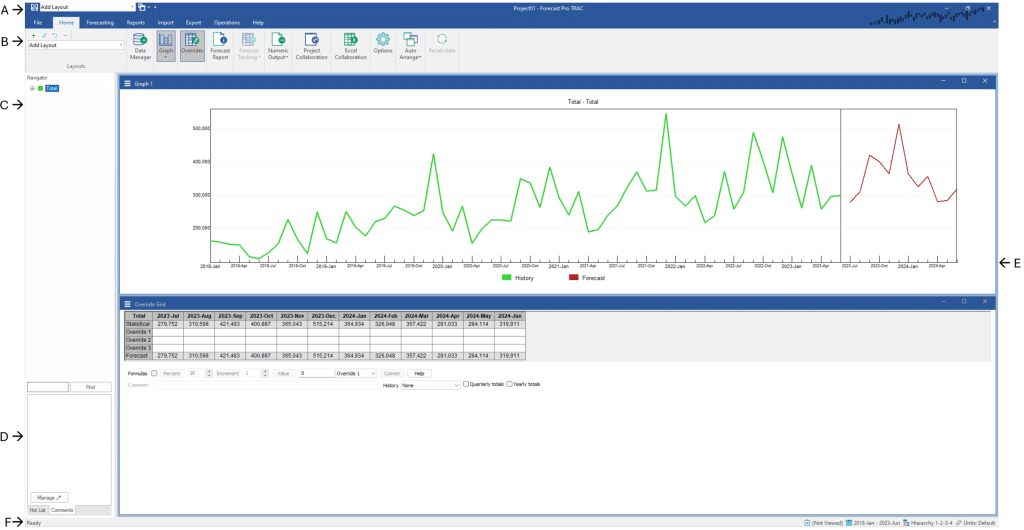
Your screen should now look like the one below.

Before we explore the forecasts, let’s examine the Forecast Pro interface. The primary display consists of a Quick Access Toolbar (A), a ribbon menu (B), a Navigator (C), a Hot List & Comments area (D), view window(s) (E) and a status bar (F).
The ribbon menu provides access to all procedures. Commonly used procedures are available on the Home tab (selected above). The Data Manager is used to read data into the project and generate the initial forecasts. Once this is complete, Forecast Pro displays all available items in the Navigator and opens the Graph view and the Forecast Override view. The Graph view displays the item currently selected on the Navigator and the Override view allows you to adjust forecasts. Other views that are available on the Home menu include the Forecast Report view, which displays the forecasting model, within-sample statistics, historic data and forecasts for the selected item, and the Forecast Tracking view, which displays a waterfall report comparing previously generated forecasts with what actually happened. Note that Forecasts Tracking is only available if there are archived forecasts (forecasts generated in prior forecasting cycles).
All views described above are context-sensitive views that display information for the item currently selected on the Navigator. The Home tab also provides access to the Numeric Output, a noncontext-sensitive view that displays forecasts and other key data for all items in the project. The Auto Arrange icon is used to tile all open views in the view window display area.

