There will undoubtedly be times when you want to judgmentally override the statistical forecasts. For instance, you may know of a large incoming order and need to change a number or two. Forecast Pro allows you to make these changes quickly and easily.
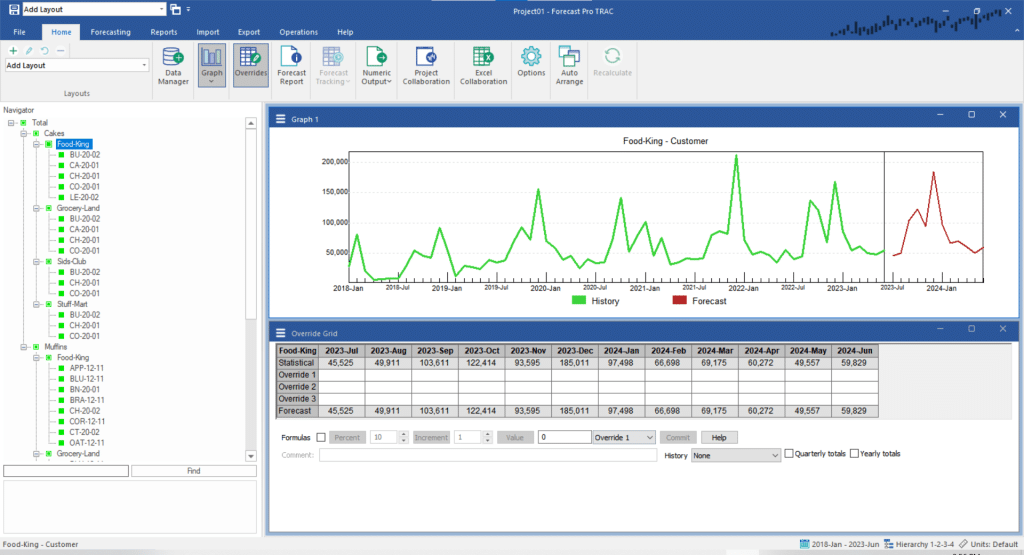
Select Total>Cakes>Food-King on the Navigator. Click the Overrides icon to open the Override grid, close the Forecast Report view by clicking the Forecast Report icon and open the Graph view by clicking on the Graph icon. Click the Auto Arrange button. Your display should look like the one below.

The Override grid provides several different ways to override the statistical forecasts. You can enter values in individual override cells, you can select a range of cells and use the Percent, Increment or Value buttons to write the desired overrides to the target override row, or you can use the mouse to drag points on the graph. If a time period has overrides in both Override 1 and Override 2, Override 2 will take precedence.
Highlight the Statistical values for August and September of 2023. Set the Percent box to 12% and click the Percent button. Notice that the proposed overrides are written to the target row indicated to the immediate left of the Commit button—in this example, Override 1. Notice also that the values displayed in the Forecast row have not changed—this is because we have not yet committed to the overrides. Uncommitted overrides are displayed in red.
Click the Commit button to accept the overrides. Notice that the formerly uncommitted values in the override row change to black, the Forecast is updated and the graph is updated.
Notice also that the icon for Total>Cakes>Food-King on the Navigator now appears in red and the icons for Total>Cakes and Total in yellow. A red Navigator icon signifies that an override has been made to the item. If a group icon appears in yellow, it signifies that an override has been made to an item lower down that branch of the hierarchy.
When you make an adjustment to an item in a hierarchy, Forecast Pro will automatically reconcile the entire hierarchy to reflect the change. Thus, when we made our override to Total>Cakes>Food-King this impacted the groups above our selection and all groups and items below our selection. Understanding how forecast overrides are allocated describes how the reconciliation is performed.
Important: If you restrict your overrides to a single level of the hierarchy, the reconciliation process is simple and intuitive. We strongly urge you to limit your overrides to a single level if possible.
We have illustrated the basics of the override facility. There is a considerable amount of additional override functionality, including the ability to:
- Associate comments with override cells
- Add and remove rows
- Name override rows
- Make overrides on the graph using your mouse
- Enter overrides as formulas
- Make incremental adjustments to the Statistical Forecast row rather than overriding the values.
You can also customize the override grid to include rows to display history, alternative units of measure, imported information (e.g., externally generated forecasts, current orders, etc.) and calculations. Some of this advanced functionality is explored in future tutorials, and all of the functionality is described in the Reference.
Turn off the Override Grid by clicking the Overrides icon or explicitly closing the view window.

