Marked content is Forecast Pro TRAC only
[TRAC] Product Mapping

The Product Mapping icon opens the Product Mapping dialog box. From this dialog box, you may interactively create product mappings from items on the Navigator.
Product Mapping is used to assign the history from one or more items (the Map from items) to another (the Map To item). The history from the Map from items is the Mapped History. If there is a single Map from item, the Map to item’s forecast history is equal to the Map from items’ history plus the Map to item’s history.
Map to Forecast History = Map from history + Map to history
Forecast Pro will use then use the defined forecast history to generate forecasts for the Map to item.
Please see Working with Product Mapping and Mapped History for a more detailed description of how product mapping works.

By Analogy
The concept behind the Forecast by Analogy model is very simple. The approach is sometimes referred to as a “looks like” analysis. The model assumes that the initial sales over the first few time periods for a new product will follow the same pattern as the initial sales of an existing, similar product as it launched. To use this method, you must supply the launch profile or “analog series” in the form of a helper variable. This launch profile is simply sales for the analog product, starting with the launch period and extending for as many time periods as deemed relevant.
If the product has not yet launched (i.e., there are no historic data available), then you must also supply an estimate of the initial sales over a specific period of time (the launch total over the launch horizon). Forecast Pro will then create the forecast by proportionally allocating the launch total over the launch horizon using the analog series to define the proportions.
If any historic demand for the new product is available, you may either supply the launch total and launch horizon or allow Forecast Pro to calculate the forecasts by fitting the existing data to the analog series.
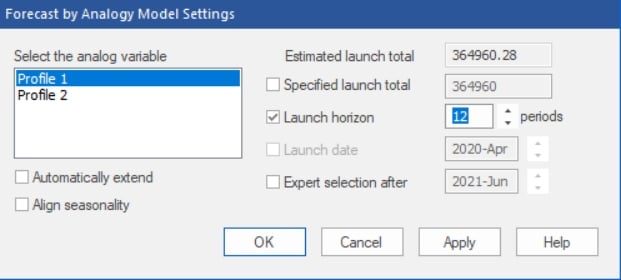
Clicking the By Analogy icon on the Forecasting tab or selecting Forecasting > New Products > By Analogy on the Navigator context menu invokes the Forecast by Analogy Model Settings dialog box shown below.

The Select the analog variable box displays the currently available helper variables and allows you to select the one you’d like to use as the analog series.
If historic demand exists, the Estimated launch total displays the launch total calculated using the current analog variable and the historic demand.
The Specified launch total allows you to input a specific launch total to use.
The Launch horizon allows you to specify the length of the launch horizon. The default launch horizon equals the length of the history, if any, plus the current forecast horizon.
The Launch date option is only available if the product has not yet launched (i.e., there is no historic demand for the product). It allows you to specify when the product will launch, allowing you to set up the forecasting model in advance of the launch date.
The Automatically extend option will automatically forecast the analog variable if it does not cover the full launch horizon.
The Align seasonality option will (if necessary) adjust the beginning period of the analog series so that it aligns with the launch date’s period. For example, if the analog series started in January and the launch date corresponded to March, then selecting this option would result in using the analog series’ first March observation as the first analog series data point (thus aligning the seasonal patterns of the analog series and the new product).
Expert selection after is used to specify a date where Forecast Pro should stop using the Forecast by Analogy method and switch to using expert selection. For example, if you set Expert selection after to June 2024, Forecast Pro would use the Forecast by analogy approach until your historic data included July 2024.
Click OK or Apply on the Forecast by Analogy Model Settings dialog box to apply the by analogy model.
The modifiers associated with Forecast by Analogy are:
- \ANALOG=X: Use the by analogy model with automatic calculation of the launch total. X is the name of the time series containing the analogy series.
- \ANALOG=X(A,B): Use the by analogy model with a specified launch total of A and a specified launch horizon of B.
- \ANALOG=X(A,B,C,D): Use the by analogy model with a specified launch total of A, a specified launch horizon of B and a specified launch date with a starting year of C and starting period of D. This option is only available when the series being forecasted has no historic data.
- \ANALOGEX, \ANALOGAL, \ANALOGD: There are three suffixes that may appear after the keyword ANALOG. EX appears if the Automatically extend option is selected. AL appears if the Align seasonality option is selected. D appears if the Expert selection after option is selected. If all three options are selected, all 3 suffixes will appear after the keyword ANALOG.
Bass Diffusion
The Bass model is most often used to forecast first time purchases of new-to-world products.
The model tries to capture the adoption rates of two types of users—innovators and imitators. Innovators are early adopters of new products and are driven by their desire to try new technology. Imitators are more wary of new technology—they tend to adopt only after receiving feedback from others.
The Bass model uses two coefficients to quantify the adoption rates. The Coefficient of Innovation, referred to in the literature as “p”, controls the adoption rate for the innovators. The Coefficient of Imitation, referred to in the literature as “q” controls the adoption rate for the imitators.
If you have 5 or more historic data points, these coefficients can be fit to the data. To build a Bass model with fewer than 5 data points you must set the values for these coefficients along with the total number of potential adopters. Typically, “p” is between 0 and 0.1, while “q” is between 0.3 and 0.5.
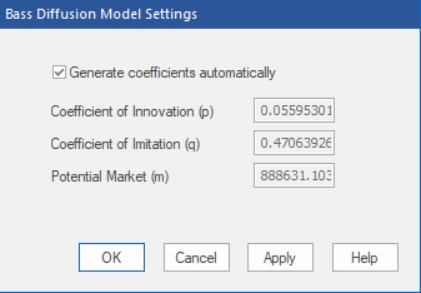
Clicking the Bass Diffusion icon or selecting Forecasting > New Products > Bass Diffusion on the Navigator context menu invokes the Bass Diffusion Model Settings dialog box shown below.

If you have five or more data points, the Generate coefficients automatically option allows you to instruct Forecast Pro to automatically fit the model parameters to the data. If you do not select Generate coefficients automatically, you’ll need to supply the model coefficients and potential market size.
The modifiers associated with the Bass diffusion model are:
- \BASS: Use the Bass diffusion model with automatically generated coefficients and potential market size.
- \BASS(p,q,m): Use the Bass diffusion model with user defined parameters p, q and m.
Custom Component Model
Click the Custom Component icon to invoke the Component Model Settings dialog box. See Custom Component Model for a detailed description of the dialog box.
The following modifier is associated with the custom component model.
- \COMP=name: Use a custom component model with the specifications defined in name.

