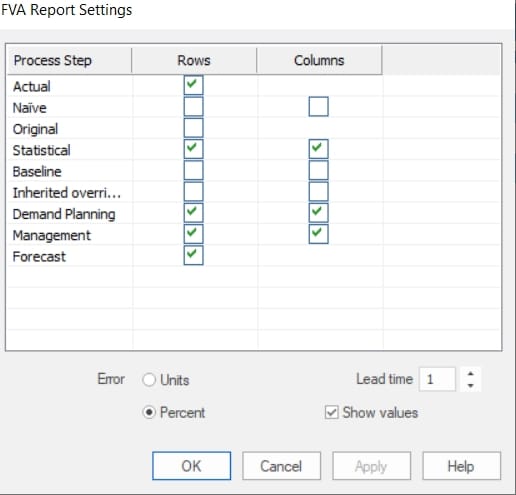
The FVA report can be customized by selecting Settings on the hamburger or context menu.

The leftmost column of the display lists the available process steps. Note that the Naïve forecast is the previous periods actual (same as last period). You may display which process steps you want to include as rows in the FVA report and which process steps you want to compare against in columns. Checking the Statistical columns checkbox tells Forecast Pro to include a “FVA versus Statistical” column.
The Error radio button allows you to select unit or percent forecast errors. The default display is Percent, but you may want to use unit errors for low volume items.
The Lead time spinner specifies the forecast lead time. In the example above, we had a lead time of 1 and a June 2023 comparison period. The FVA report uses the June 2023 forecasts that were generated with data through May 2023 when June was “one-month-ahead.” If we changed the lead time to 3, the FVA report would show the June 2023 forecasts generated with data through March 2023, when June was “three-months-ahead.”
Unchecking the Show values checkbox removes the Value column from the display.
Close Tutorial – Accuracy without saving any changes. This concludes the Tracking Forecast Accuracy lesson.

