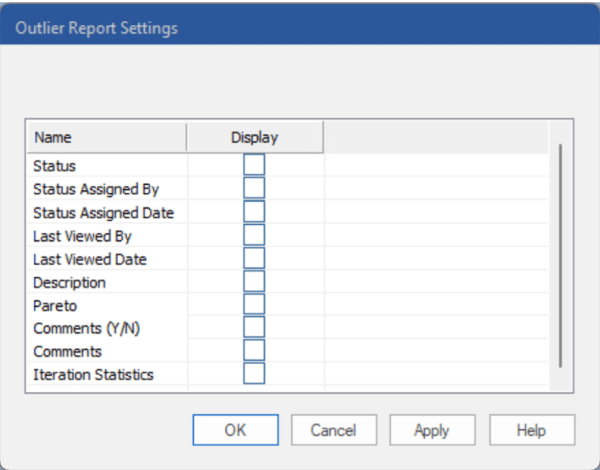
The outlier report lists items where outliers have been detected and/or corrected. To open the outlier report view, click the Outliers icon on the Reports tab.
To customize the display, open the Settings dialog from the hamburger menu or the context menu.

The Settings dialog lists the optional columns you may include in the Outliers Report.
Status: Displays the status.
Status Assigned By: Displays the user who assigned the status.
Status Assigned Date: Displays the date the status was assigned.
Last Viewed By: Displays the user who last viewed the item.
Last Viewed Date: Displays the date the item was last viewed.
Description: Displays the Description for the item in the historic data file.
Pareto: Includes four additional columns: Pareto, % of Total, Ranking and Cumulative %. Consult The Pareto Tab for more information.
Comments (Y/N): Displays a value of Yes or No to identify which items have item-level comments associated with them.
Comments: Displays the most recent comment.
Iteration Statistics: Includes 5 additional columns which gives you more insight into the order in which the outliers were detected and why.
Custom Filters: If you have included filters in the project (see Custom Filter Fields in Setting Up Your Optional Data), you may add those to the report.
The Outliers tab of the Options controls the detection and correction settings. Consult Outliers for more details. The Forecast Pro Statistical Reference Manual also provides additional details on Forecast Pro’s outlier detection methodology.

