Forecast Pro TRAC only
The Forecast Value Add (FVA) view is designed to show the accuracy and value-add of each step in your forecasting process for the prior forecasting period. The FVA will not be available until you have established archived forecasts (usually by going through at least one forecasting cycle).
The first step in your process is generating your baseline forecast. Typically, the baseline forecast is the statistical forecast. This baseline forecast may then be updated with overrides. The FVA report shows if those overrides were more or less accurate than the baseline forecast. It also shows if the net impact of those overrides, as reflected in the final forecast, was positive or negative. If your final forecast was more accurate than the baseline forecast, your process added value. If not, you may want to understand how to adjust your process so that it is improving baseline forecasts instead of making the forecast less accurate.
To open the FVA report, click the FVA Report icon on the Reports tab. This is an item-specific view. The FVA Report has a global equivalent (FVA Global Report in the Exception Reports section of the Reports tab), but the following information refers to the item-specific view.

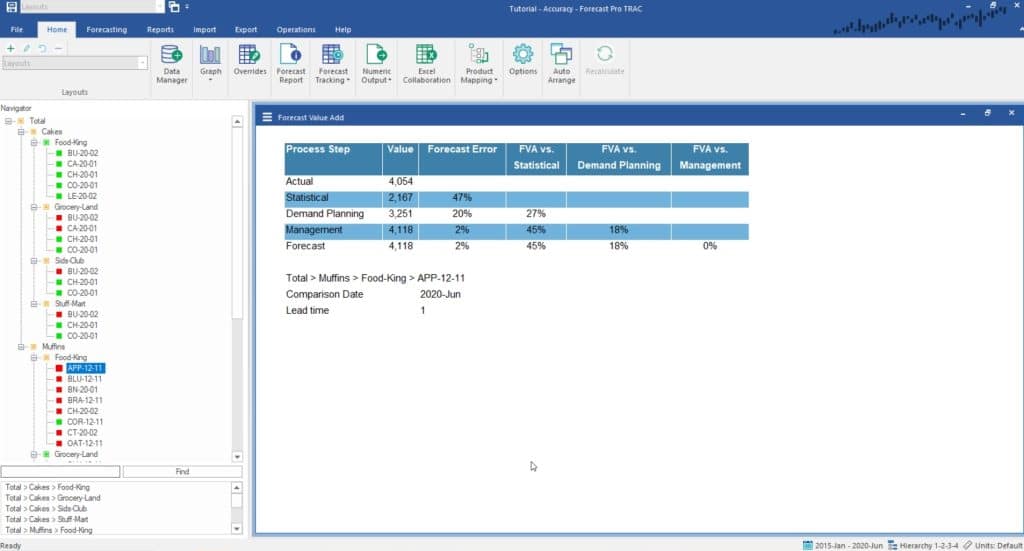
The selected item (Total>Muffins>Food-King>APP-12-11 in this case) is shown beneath the report, along with the comparison date and the lead time you want to review.
The Value column shows the observed historical value for the Actual row and forecasted values for all other rows. The Forecast Error column shows the absolute error, either as a unit deviation or a percentage, for each process step. The remaining columns show the relative impact on forecast accuracy of each process step throughout the forecasting process.
In the example above, the statistical forecast had a forecast error of 47% while the Demand Planning override of 3,251 had a forecast error of 20%. The Demand Planning override was 27% (=47%-20%) more accurate than the statistical. That is, the Demand Planning override added value. The Management override had a forecast error of only 2%, adding 45% (=47% – 2%) of value relative to the statistical forecast and 18% (=20% – 2%) relative to the Demand Planning forecast. In this example, each step of the forecasting process added value.
The FVA report can be customized by selecting Settings on the hamburger or context menu.

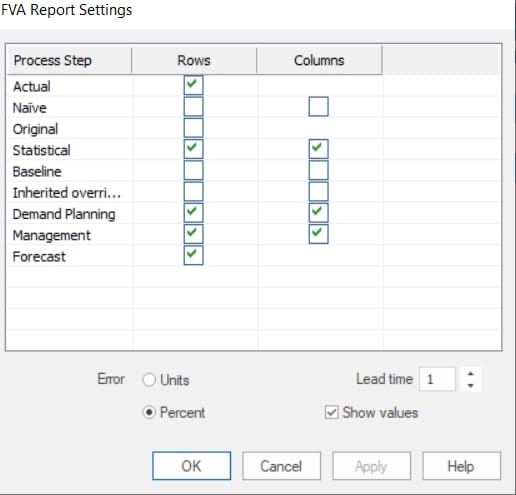
The leftmost column of the display lists the available process steps. Note that the Naïve forecast is the previous periods actual (same as last period). You may display which process steps you want to include as rows in the FVA report and which process steps you want to compare against in columns. Checking the Statistical columns checkbox tells Forecast Pro to include a “FVA versus Statistical” column.
The Error radio button allows you to select unit or percent forecast errors. The default display is Percent, but you may want to use unit errors for low volume items.
The Lead time spinner specifies the forecast lead time. In the example above, we had a lead time of 1 and a June 2020 comparison period. The FVA report uses the June 2020 forecasts that were generated with data through May 2020 when June was “one step ahead.” If we changed the lead time to 3, the FVA report would show the June 2020 forecasts generated with data through March 2020, when June was “three steps ahead.”
Unchecking the Show values checkbox removes the Value column from the display.
One of the goals of FVA analysis is to understand which items and process steps are improving forecast accuracy and which are decreasing accuracy. The FVA Global exception report allows you to view FVA statistics and filter across all items so that you can easily identify which items add value (improve accuracy) and which do not.

