Marked content is Forecast Pro TRAC only

Date Range Group: The Date Range controls are used to set the span of data used when estimating forecast models, define a holdout sample and reset dates to the default of using all available data without a holdout sample.
Year and Period: The Year and Period spinners are used to define the fit set. All time series methods begin by fitting a model to historic data. You can alter the beginning year and beginning period to specify the first point of the fitting sample and/or the ending year and ending period to specify the last point. By default, Forecast Pro selects the largest fit set for which data exists. Normally, you will want to accept the defaults. However, you may want to ignore earlier data if you distrust their relevance.
Please note that the fit set selected is applied to all forecasted items, unless you have used the Start Dates icon on the Forecasting tab to specific alternative start dates for individual items.
Holdout Periods:This spinner is used to specify the length of a holdout sample. When using a holdout sample, Forecast Pro withholds the specified number of periods at the end of the data from the model fitting. If you withhold 2 or more points, Forecast Pro automatically generates out-of-sample evaluation statistics for any models that you build. These statistics are available in the Forecast Report. If you do not want to perform out-of-sample testing, set the holdout sample to zero (the default).
Read Data: The Read Data iconreads in the Historic Data defined in the Data Manager from its primary source along with any other inputs where the on Read option is selected.
Forecast: Clicking the Forecast icongenerates statistical forecasts. This option is only available when historic data has been defined in the Data Manager and the data has been read in. Changes to the date range used may require you to re-forecast the data.
Recalculate: This option is only available after changing the date range or when Manual override mode or Manual forecast mode is selected on the Performance tab of the Options dialog box (see The Performance Tab). Selecting the Recalculate icon will reconcile all forecasts and overrides.
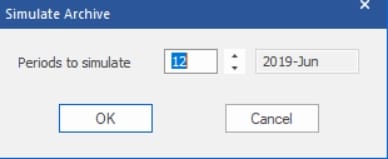
[TRAC] Simulate Archive: The Simulate Archive icon is used to generate statistical forecasts for previous forecast origins (last period used to generate a forecast) and to insert them into the Forecast Pro database. Essentially this is a form of simulation that allows you to initialize the forecast archive with statistical forecasts. Clicking the Simulate Archive icon opens the following dialog box.

The Simulate Archive dialog box allows you to specify how many periods you wish to initialize or simulate. Forecasts will be generated for the specified period and all subsequent periods up to the current origin.
In the example above, the current origin (last period of historic data) is June 2020. The periods to initialize is set to 12, which corresponds with a forecast origin of June 2019 (12 periods prior to the current origin). Simulation would begin by generating forecasts using data up to and including June 2019 and inserting them into the database. It would then generate forecasts using data up to and including July 2019 and insert them into the database. It would continue this process until all 12 forecasts sets had been generated and inserted into the database.
[TRAC] Time Fence Group: Please consult Using a Time Fence for a detailed description of time fences.
Enable: The Enable icon turns on a time fence for the current project. Once you turn a project’s time fence on, it cannot be turned off!
Freeze Next Period: Clicking the Freeze Next Period iconwill increase the length of all time fences in the current project by one period. If you subsequently update your data with the next observation and create a new forecast (thus changing the forecast origin), the time fence length will revert to their pre-Freeze-Next-Period settings. This option provides a way of insuring that after the forecasts are finalized, the user cannot inadvertently alter the frozen periods’ forecasts prior to the data being updated, new forecasts being generated and the frozen periods’ forecast becoming an officially fenced value.
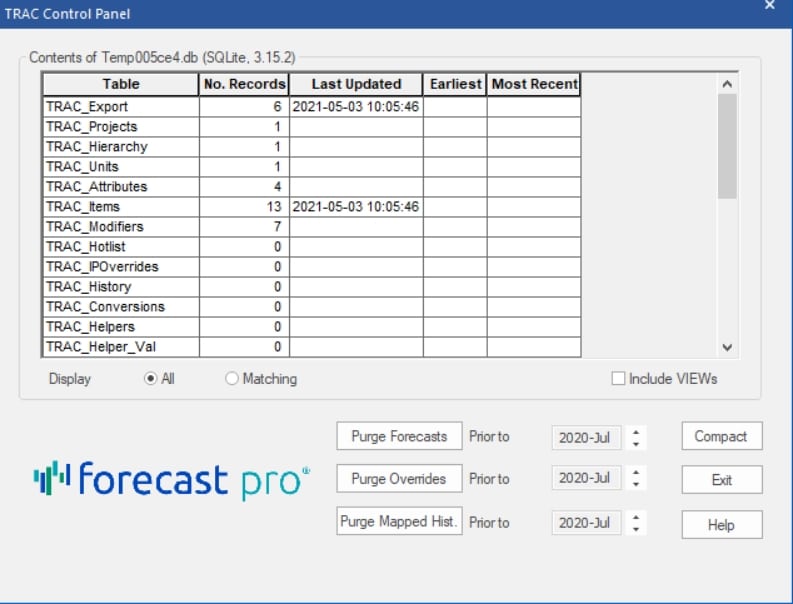
[TRAC] Control Panel: The Control Panel icon invokes the TRAC Control Panel dialog box which is used to view information about the current project’s database and to purge unwanted or obsolete forecasts and overrides.
Important: To reduce the size of the Forecast Pro database file, you must use the Compact button after purging forecasts and overrides. Purging without compacting results in the records being deleted from the database but does not change the file size.

The grid displays the contents of the database.
The Purge Forecasts button will delete all forecasts prior to the specified date.
The Purge Overrides button will delete all overrides prior to the specified date.
The Purge Mapped Hist. button will delete all mapped histories prior to the specified date. When there is no mapped history, Forecast Pro uses the actual history in the historic data file for forecasting.
The Compact button consolidates the Forecast Pro database file. Use this button to reduce the size of the database file after purging forecasts and/or overrides.
Password: This icon is used to password protect your project. When you attempt to open a password-protected project, Forecast Pro will prompt you for the password and only open the project if the correct password is entered.
[TRAC] Reorder Hierarchy: The Reorder Hierarchy icon used to “shuffle” (rearrange) the hierarchy displayed on the Navigator. Reading data into Forecast Pro establishes the default hierarchy. If the default hierarchy contains 4 levels, the notation 1-2-3-4 is used to represent the default state. Selecting Reorder opens a dialog to redefine the hierarchy by moving the currently selected level “up” or “down” one level. For example, promoting level 3 of a 4-level default hierarchy, would change the displayed hierarchy from 1-2-3-4 to 1-2-4-3. Hierarchy>Restore Defaultconverts the currently displayed hierarchy back to the default hierarchy. You may also access the Reorder the Hierarchy dialog in the Navigator Context menu.
[TRAC] Units: The Units drop-down box is used to change the display units. This box will only be available if you have defined conversion factors for your current data set in the Data Manager. The Units icon on the status bar will display the Units drop-down selection. Consult Conversion Factors for details.
Changing the display units and/or altering the hierarchy will “lock” the statistical forecasts. When the statistical forecasts are locked, you are no longer able to change the statistical forecasting methods used to generate the statistical forecasts and the sections of the Forecast Report that pertain to the statistical modeling (i.e., Expert Analysis, Model Details, Within-Sample Statistics, Out-of-Sample Tests and Outliers) are omitted. If you subsequently return to the default state (i.e., default units and default hierarchy) the statistical forecasts will be “unlocked.” Consult Understanding How Forecast Overrides are Allocated for more details.

