Marked content is Forecast Pro TRAC only

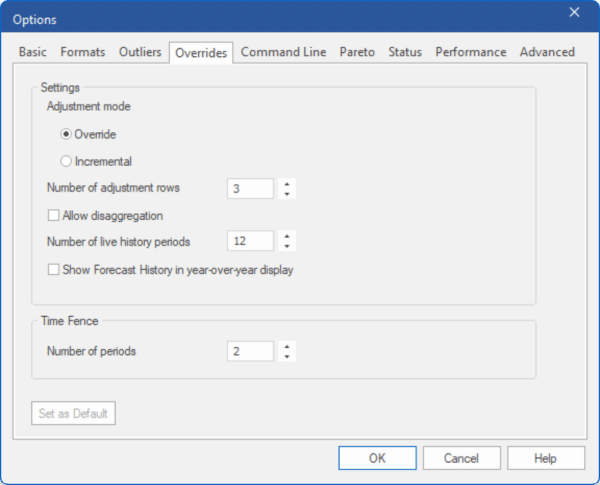
The Overrides tab controls operation and display of the Override view.
Adjustment mode: If this selection is set to “Override” any overrides entered will replace the corresponding baseline forecasts (or overrides entered on a preceding row). If this switch is set to “Incremental” overrides you enter will be added as incremental adjustments to the baseline forecast rather than replacing it, and the final forecast will equal the sum of the statistical forecast and all overrides entered. If you attempt to change this setting when overrides exist for the current project, you will receive a warning and all overrides will be erased.
Number of adjustment rows: This setting controls the default number of adjustment rows displayed in the Override view.
Allow disaggregation: If this switch is on, the Override window will include a “Disaggregate to” drop-down box, allowing you to disaggregate (i.e., push down) any overrides made at a group level to lower levels of the hierarchy. The disaggregation is based on a proportional allocation.
[TRAC] Number of live history periods: This setting controls the number of historic periods shown on the override grid when the history display option is set to Time Series. Including many historic periods may have an impact on performance (speed) when working with large projects.
[TRAC] Show Forecast History in year-over-year display: If this switch is checked, the override grid will show forecast history instead of observed history in the year-over-year display. If it is not checked, the override grid will display the observed history from the Historic Data source(s). Note that if no mapping history exists, the forecast history is the same as the observed history.
[TRAC] Time Fence: Number of periods. This option allows you to set the default length for the time fence. This setting can be overridden on an item-by-item basis using the \TIMEFENCE= modifier.

