Exception reports enable you to quickly find cases where your forecast error or some other performance metric has fallen outside of an acceptable range. Exception reporting reduces the need for manual review of your forecasts and allows you to focus on the items where human attention is most needed.
Forecast Pro provides a wide array of exception reports, allowing you to monitor the current history, forecasts and previously generated forecasts.
Start Forecast Pro and open the project, Tutorial – Exception Reporting. This project contains forecasts for the cakes and muffins data that we worked with in previous lessons.
Select the Reports tab to view the available Exception Reports. The Exception Reports are the six reports with a small, flag icon: Forecast vs. History, Forecast vs. Archive, Forecast Accuracy, Waterfall, FVA Global and Custom. You can access the settings for these 6 reports from the Settings drop-down. Click the Forecast vs. History icon and then the Auto Arrange icon to tile the views.
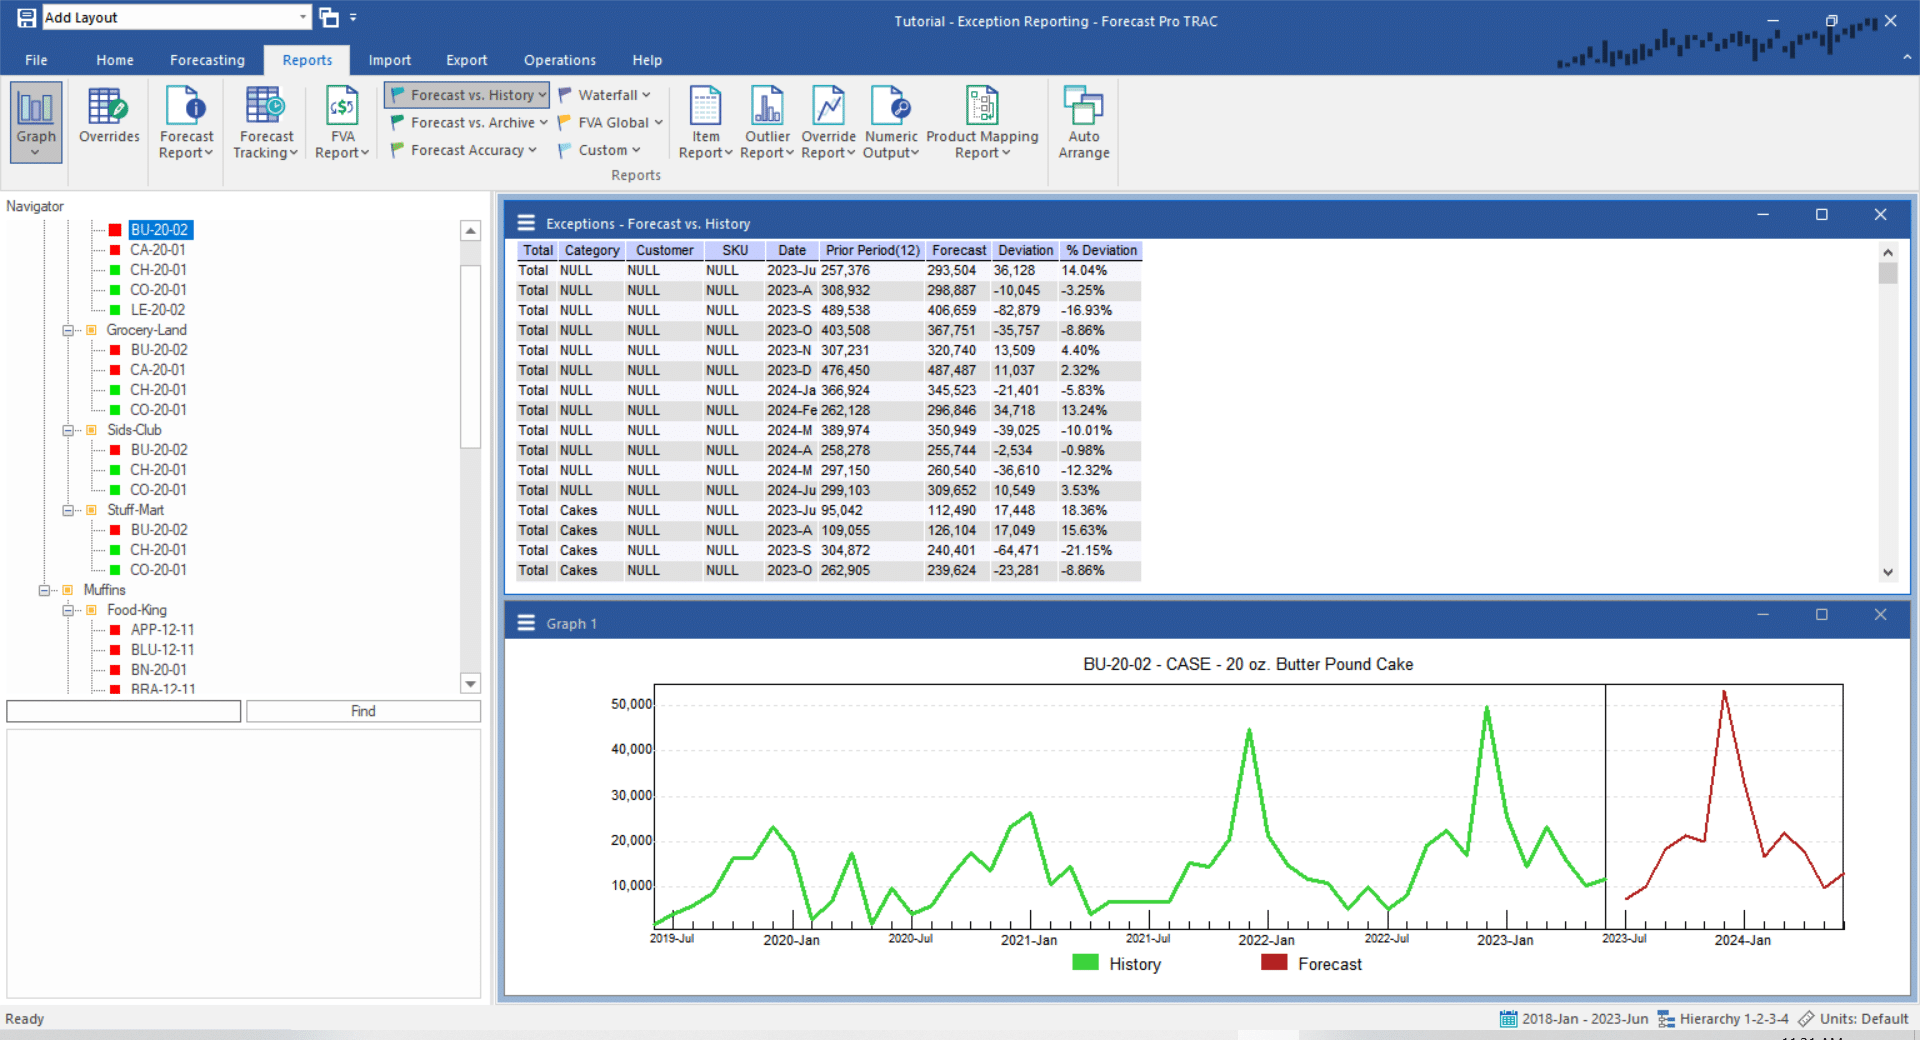
The first four columns of the report identify the item. The Date column identifies the forecast date. The next two columns (Prior Period(12) and Forecast) display each item’s historic value for 12 months prior to the date and it’s forecast value, respectively. The Deviation column shows the difference between the Forecast and the Prior Period(12) and the % Deviation column shows the difference as a percentage.
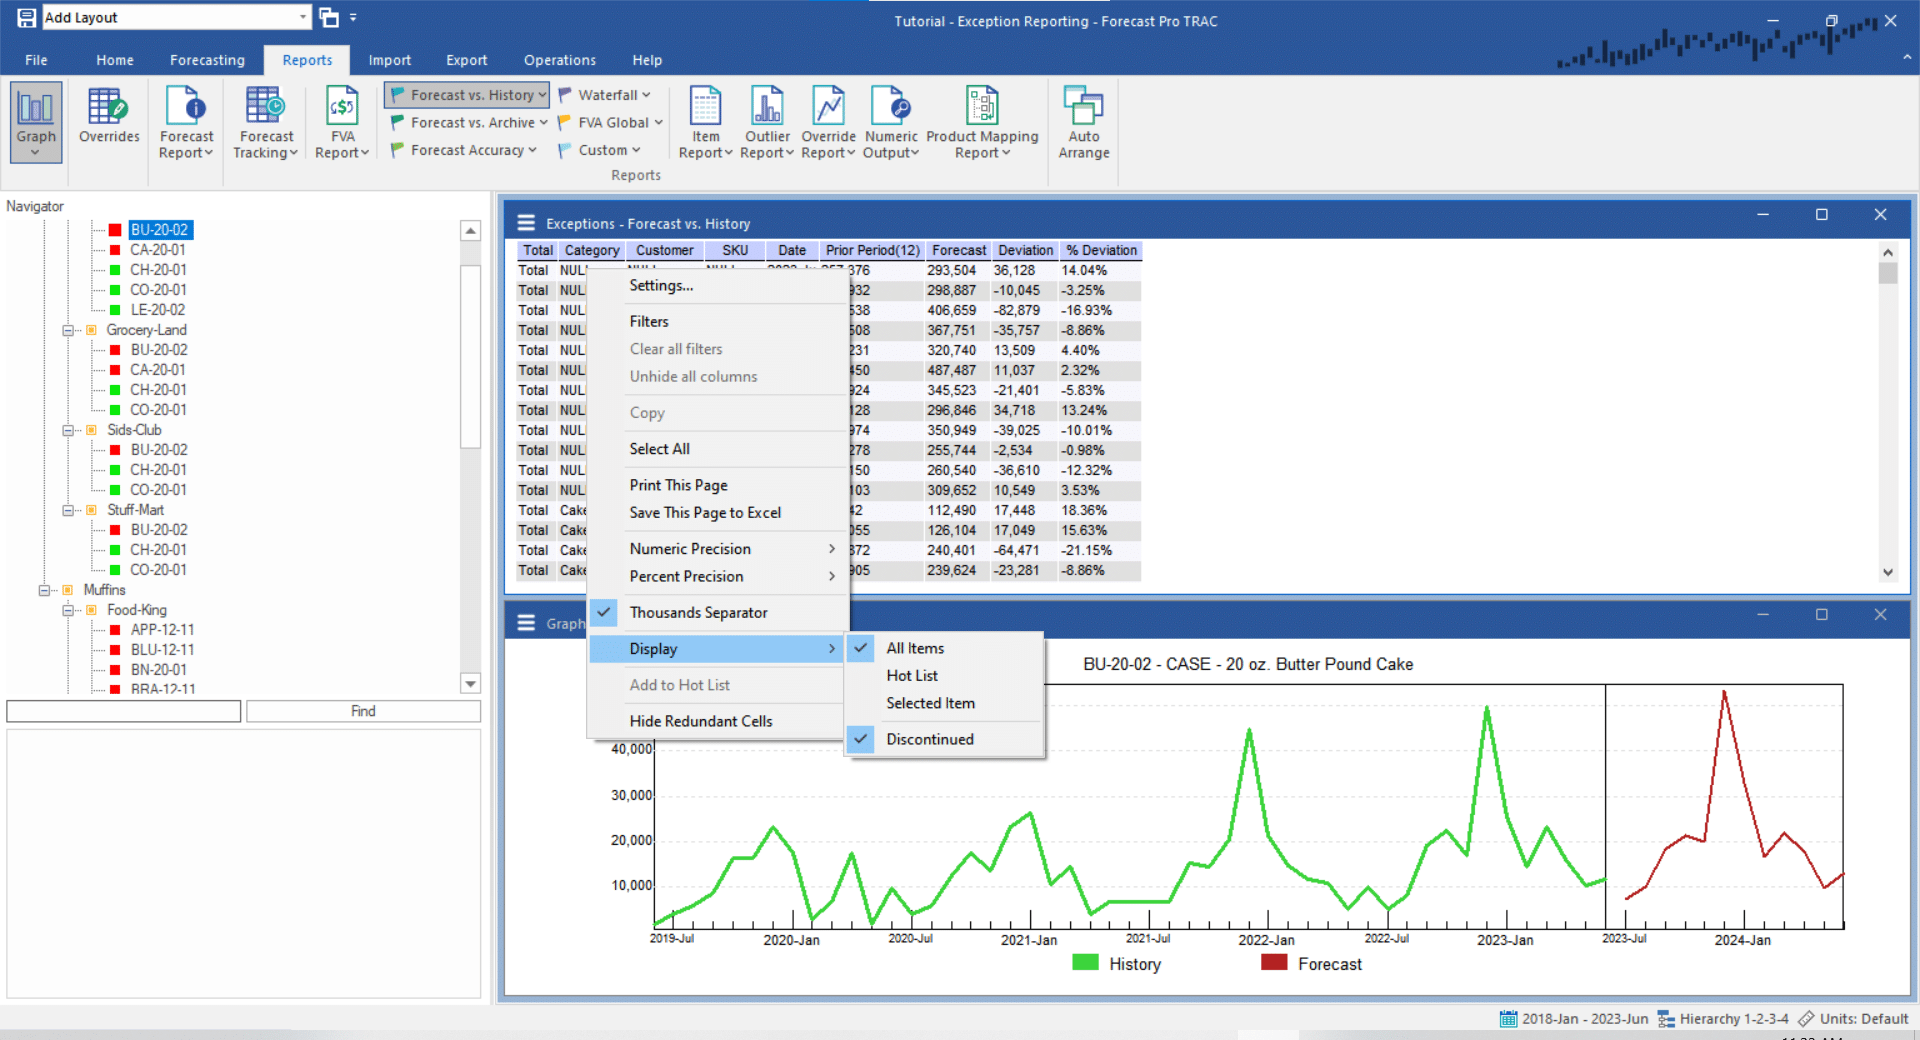
Right-click on the exception report to open the context menu, or open the hamburger menu, and then open the Display sub-menu. Note that Display>All Items is currently selected on the context menu. We are also able to display in the report only Hot List items or only the currently selected item on the Navigator. Choose Display>Selected Item and use the Navigator to change the selected item a few times to get a feel for how this works. Once you’re comfortable with the selected item mode of operation, right-click on the exception report again to call up the context menu (or open the hamburger menu) and select Display>All Items.
Let’s sort the exception report by the percent deviations. Open the hamburger menu or context menu and select Filters. Click the drop-down on the % Deviation column. Select the “Sort Largest to Smallest” and “Absolute Value” checkboxes. On the Color drop-down, select “Green – yellow – red” and click OK. Notice that the report is now sorted by the percent deviations, with the largest deviations colored red and the smallest colored green.
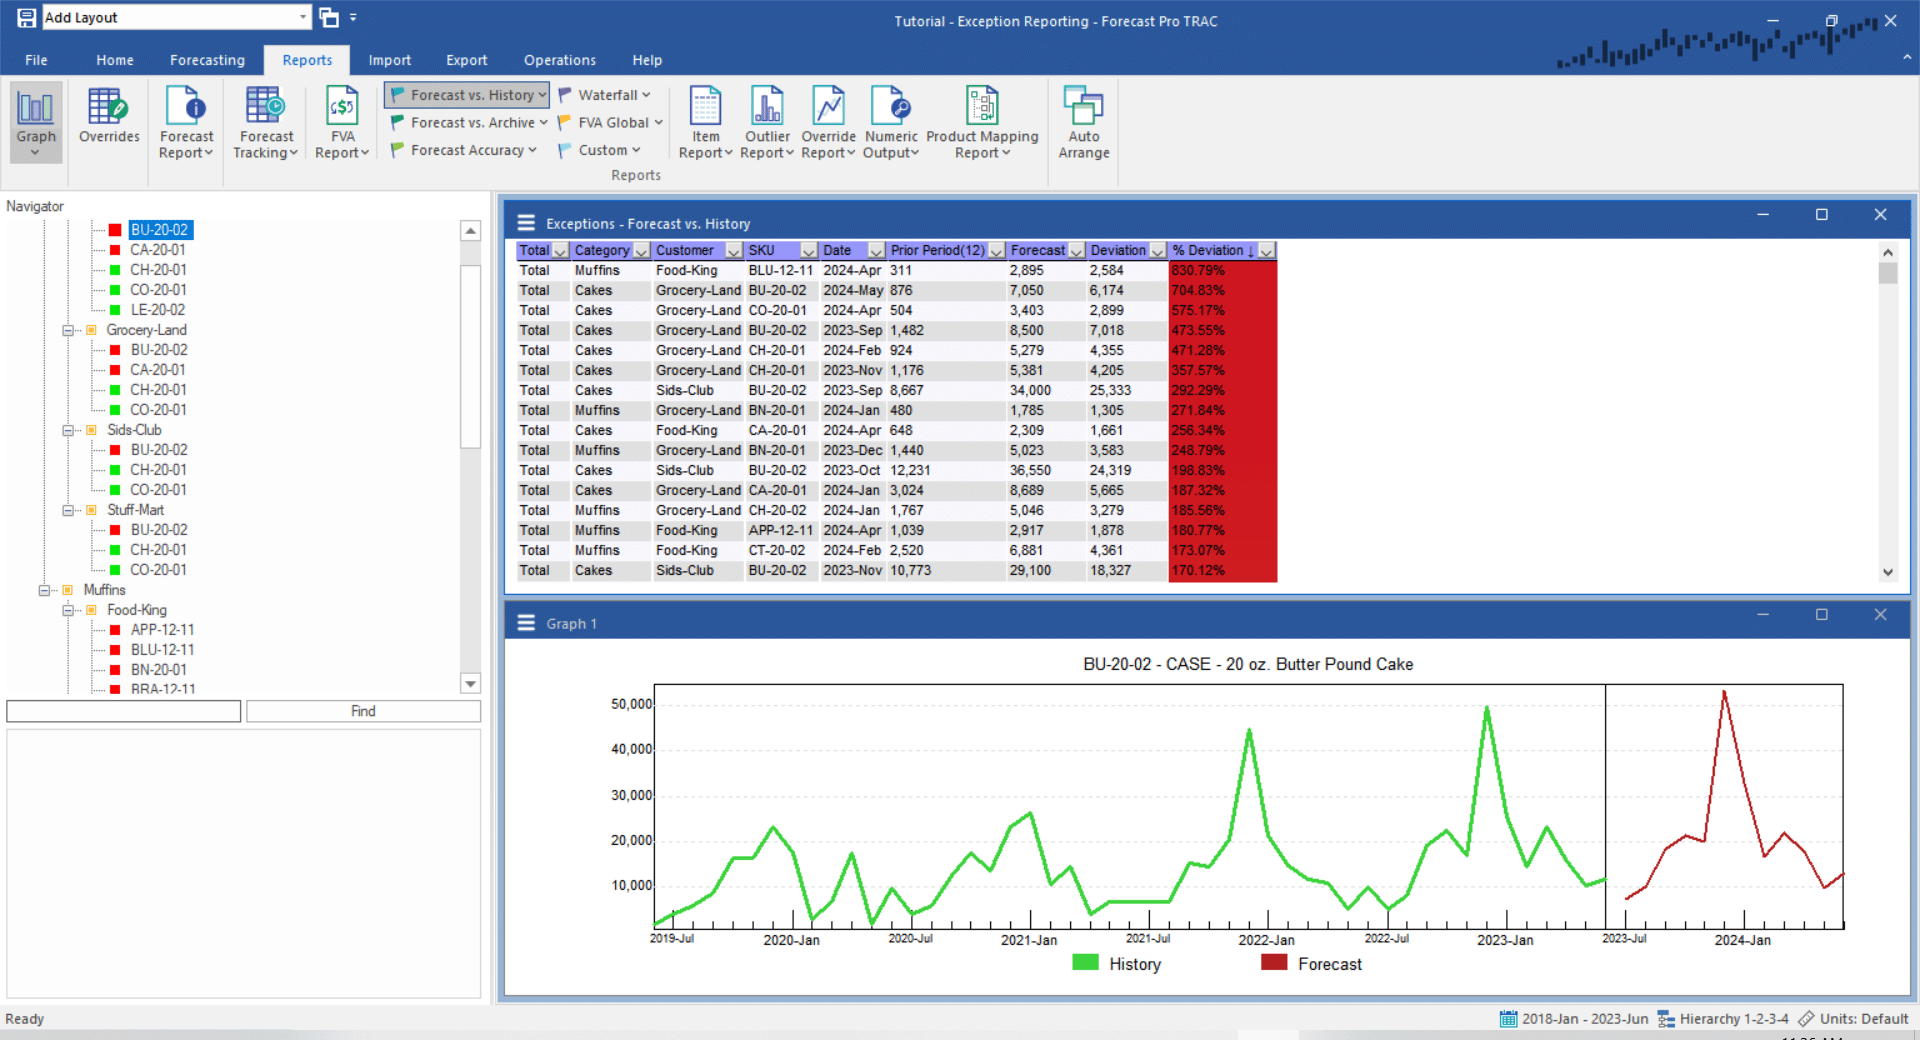
Point to the first item on the exception report and double-click. Point to the second item on the report and double-click. Notice that when you double-click an item on the exception report, the Navigator jumps directly to that item. Thus, you can use the exception report as the equivalent of a Hot List to navigate through the listed items. All of the global report views support this kind of navigation.
Let’s now refine the report to only display items that have percent deviations greater than 30% or less than -30%. Click the drop-down on the % Deviation column. Select Numeric on the drop-down menu to bring up the Numeric Filter dialog box shown below.
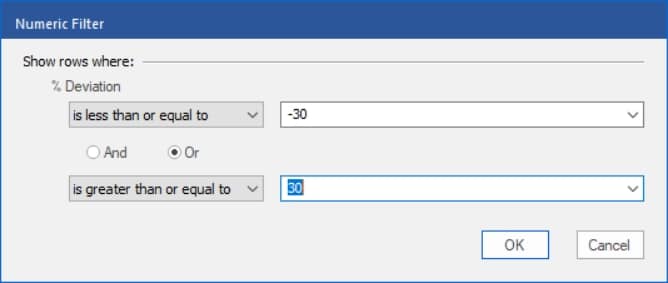
On the drop-down below % Deviation (currently showing equals), select is less than or equal to. In the text box to the right enter “-30”, select the Or radio button and on the bottom drop-down select is greater than or equal to. In the text box to the right enter “30”and click OK.
If you scroll to the bottom of the report, you will see that the report shows NAs (Not Available) as well as items that have percent deviations below -30% or above 30%. Filter out NAs by unchecking “Not Available” in the % Deviation filter drop-down and clicking OK.
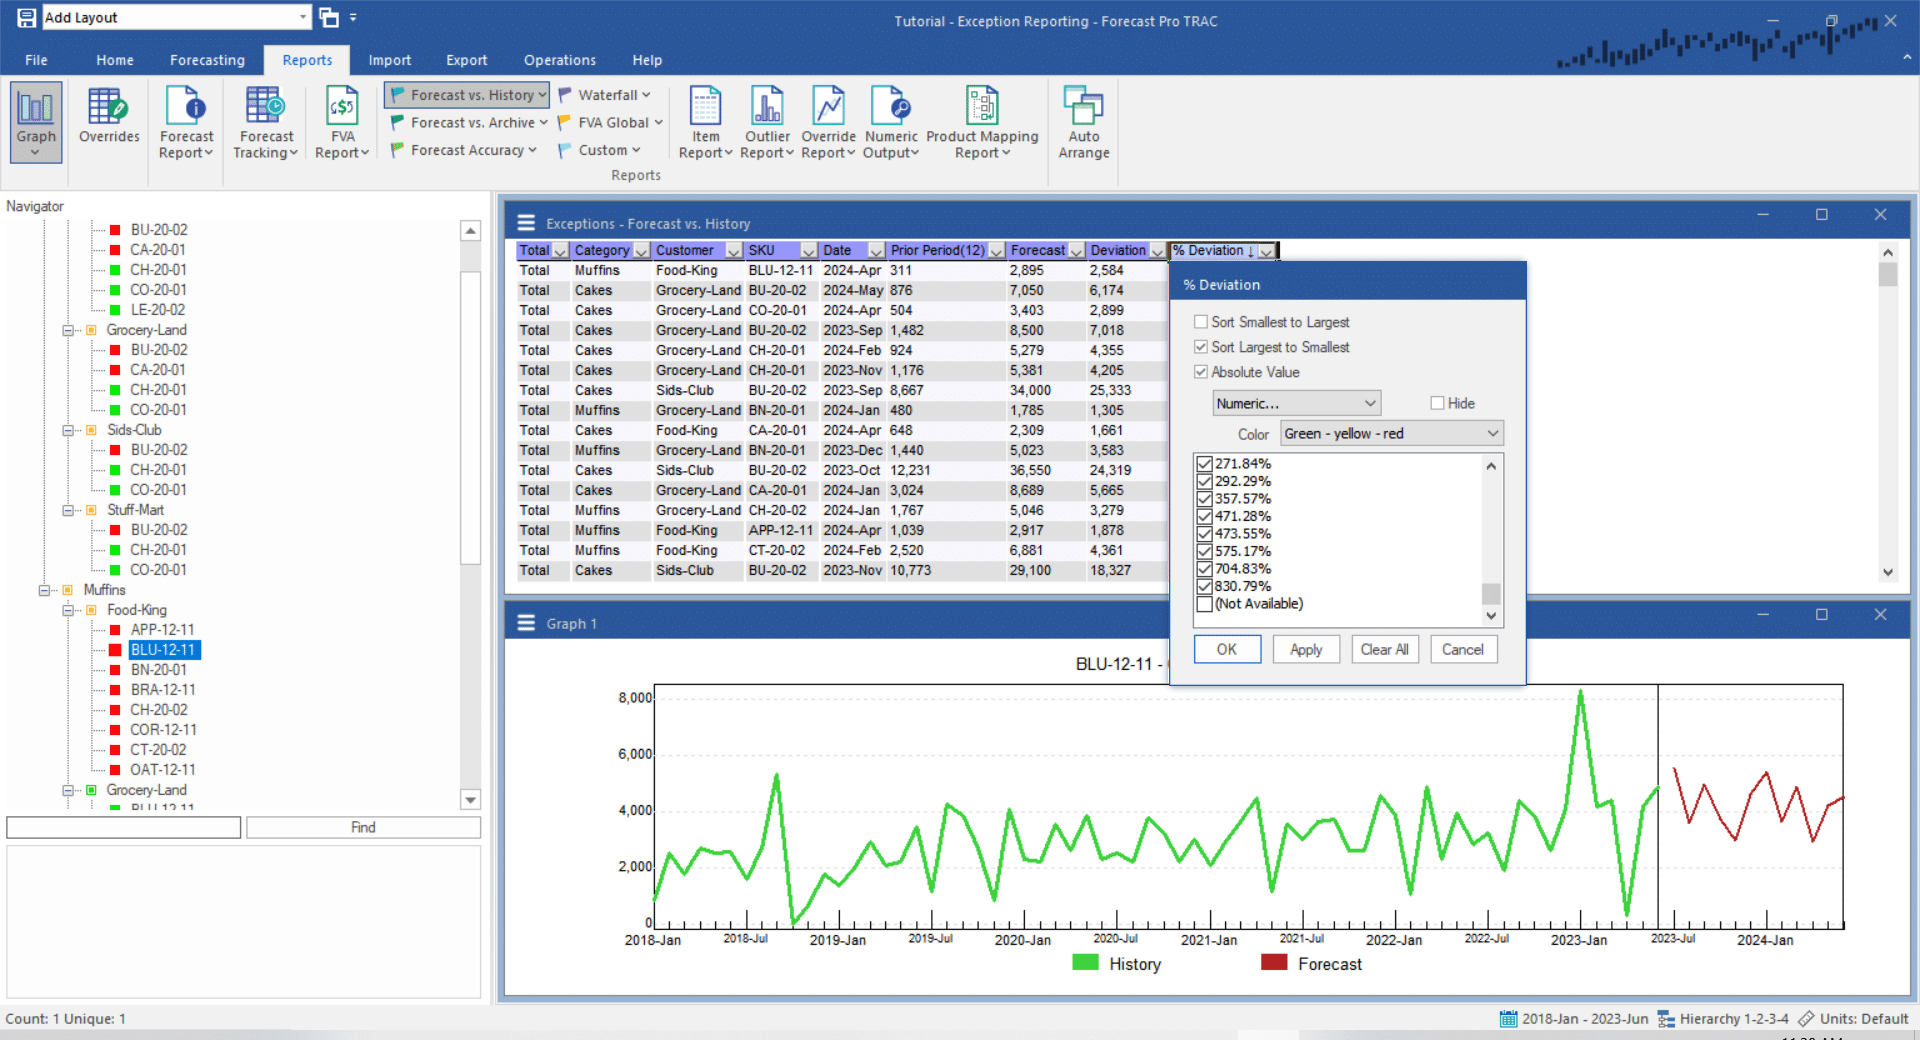
Now let’s create a layout for this view. Select the Home Tab. In the layouts group on the left, select the “+” icon above the layouts drop-down. The below dialog box should come up.
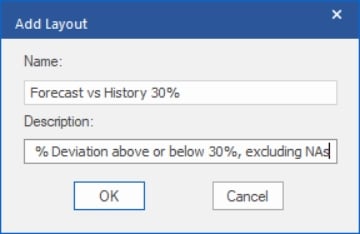
In the Name textbox, enter “Forecast vs. History 30%.” In the Description text box, enter “All items with % deviation above or below 30%, excluding NAs.” Click OK to save the layout. We will use this layout to return to this display later in the lesson.

