Forecast Pro includes six different exception reports. Let’s take a quick look at each of these using a set of layouts in our project.
Forecast vs. History
Open the layout drop-down on the Home tab or the Quick Access Toolbar and select R1: Forecast vs. History. Double-click on the first entry on the report to jump to it. Right click on the exception report to invoke the context menu and select Settings. Your screen should look like the one below.
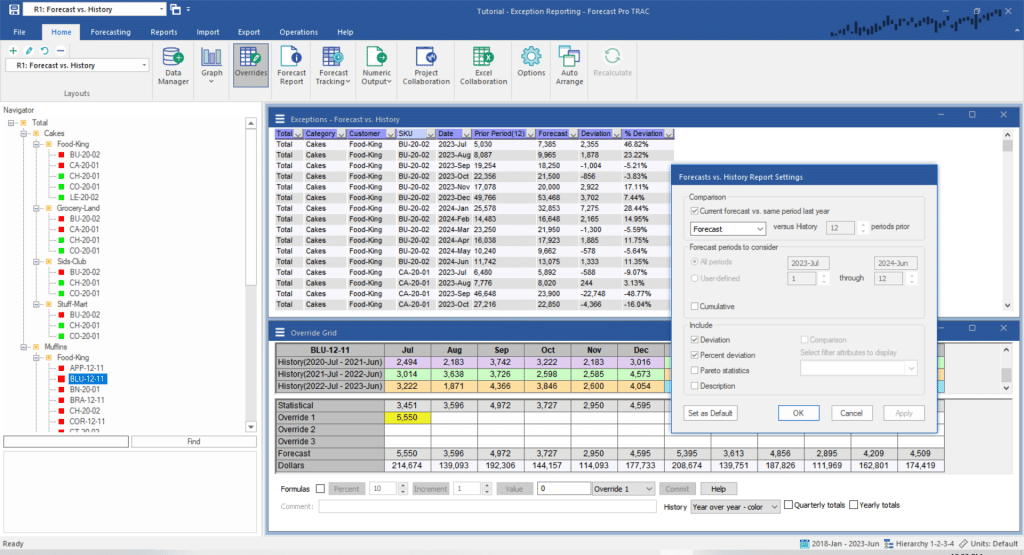
The Forecast vs. History report compares forecast values to prior historical values. We explored this report in detail earlier in the lesson.
The current report compares the forecast to the historic value 12 months prior. Notice that the values listed in the report for Forecast and Prior Period(12) match their counterparts in the override grid. Click OK to exit the Forecast vs History Settings dialog box.
Forecast vs. Archive
Open the layout drop-down and select R2: Forecast vs. Archive. Double-click on the first entry on the report to jump to it. Right click on the exception report to invoke the context menu and select Settings. Your screen should look like the one below.
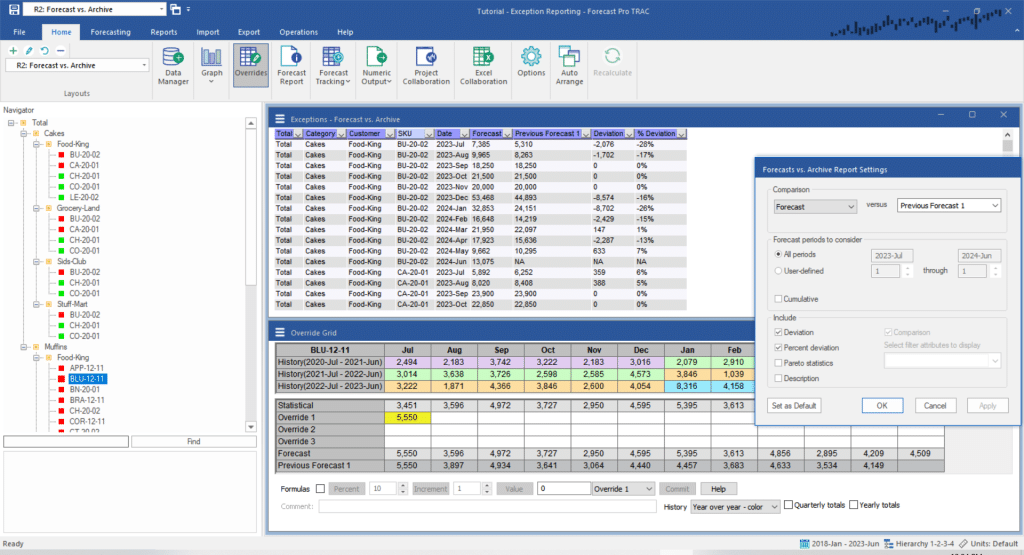
The Forecast vs. Archive report compares the current to previously generated forecasts. The current report compares the current forecast against the forecast we made last month. Notice that the values listed in the report for Forecast and Previous Forecast 1 match their counterparts in the override grid.
Experiment with the report settings until you are comfortable with their operation. Click OK to exit the Forecast vs. Archive Settings dialog box when you have finished.
Forecast Accuracy
Open the layout drop-down and select R3: Forecast Accuracy. Double-click on the first entry on the report to jump to it. Right click on the exception report to invoke the context menu and select Settings. Your screen should look like the one below.
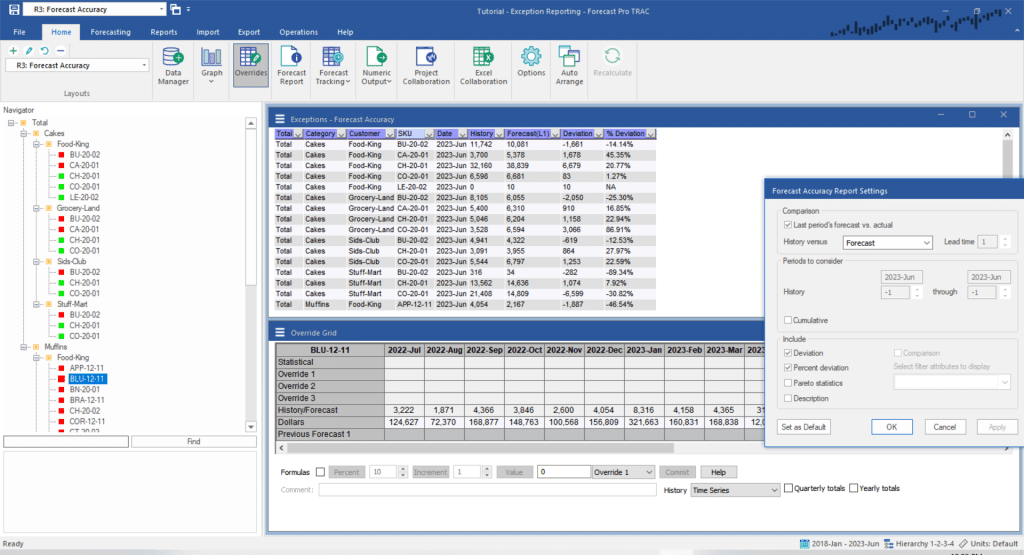
The Forecast Accuracy report looks at previously generated forecasts vs. what actually happened. The current report compares the last forecast we made for June 2023 against what happened. Notice that the values listed in the report for Forecast(L1) and History match their counterparts in the override grid.
Experiment with the report settings until you are comfortable with their operation. Click OK to exit the Forecast Accuracy Settings dialog box when you have finished.
Custom
Open the layout drop-down and select R4: Custom. Double-click on the first entry on the report to jump to it. Right click on the exception report to invoke the context menu and select Settings. Your screen should look like the one below.
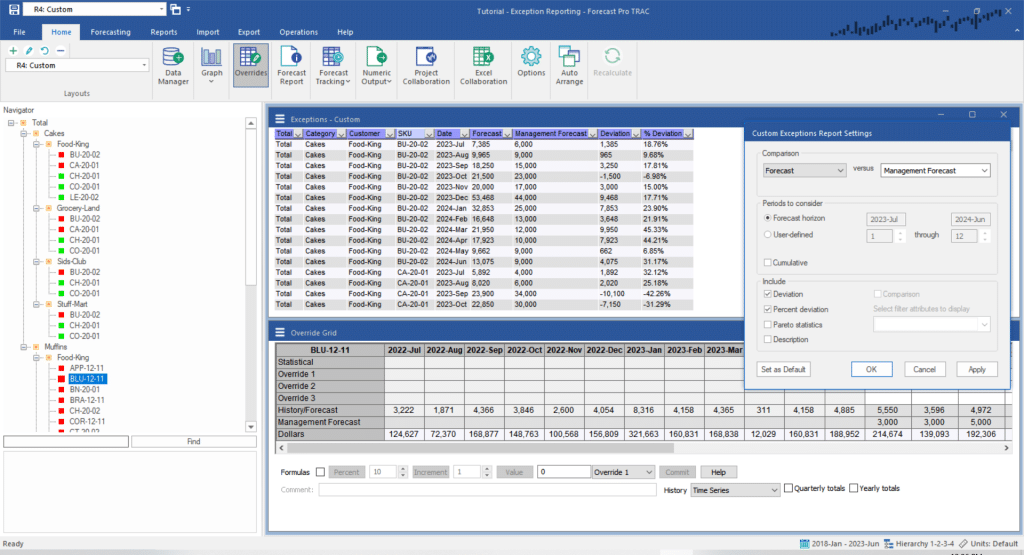
The Custom report compares forecast or historical values with any row(s) available in the override grid. The current report compares our current forecast for July 2023 to what the Management Forecast is (an external variable). Notice that the values listed in the report for Forecast and Management Forecast match their counterparts in the override grid.
Experiment with the report settings until you are comfortable with their operation. Click OK to exit the Custom Settings dialog box when you have finished.
Waterfall
Open the layout drop-down and select R5: Waterfall. Double-click on the first entry on the report to jump to it. Right click on the exception report to invoke the context menu and select Settings. Your screen should look like the one below.
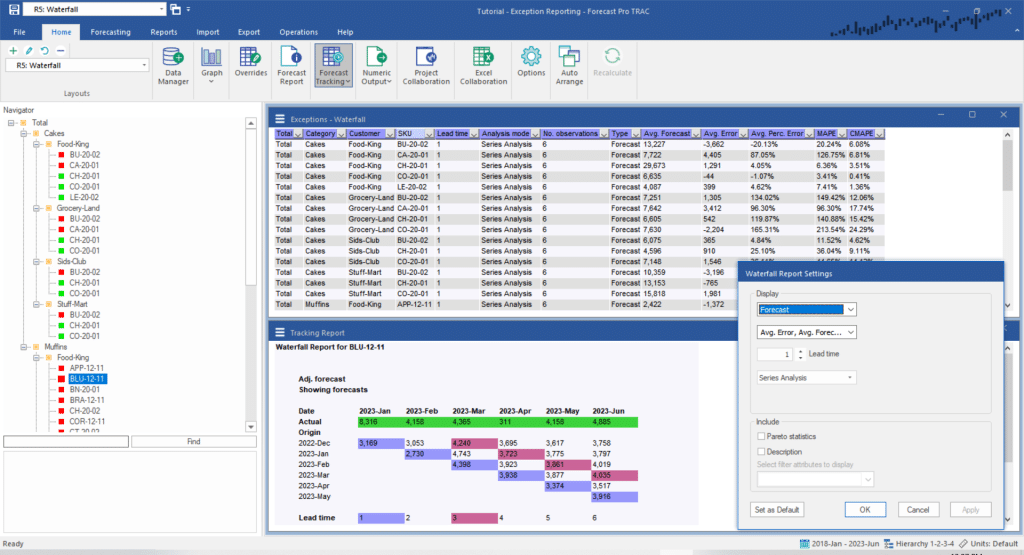
The Waterfall report provides a complete summary of forecast accuracy across lead times. It doesn’t compare items and calculate deviations like the other exception reports. It simply allows you to list statistics from the Tracking Report in a global report that can be sorted and filtered to aid in your review process.
FVA Global
Open the layout drop-down and select R6: FVA Global. Double-click on the first entry on the report to jump to it. Right click on the exception report to invoke the context menu and select Settings. Your screen should look like the one below.
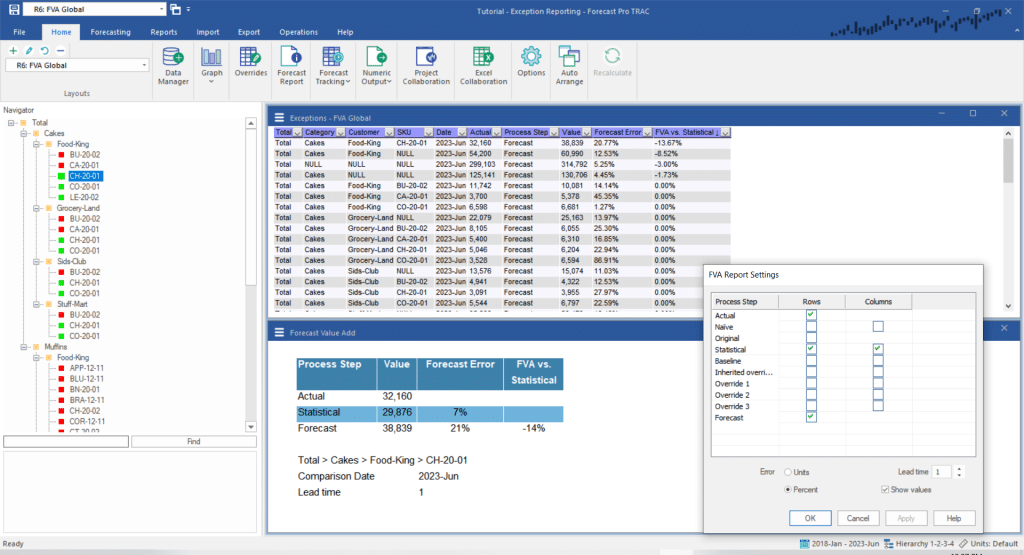
The FVA Global report provides a complete summary of forecast accuracy across steps in your forecasting process. The layout above shows last forecast period’s accuracy for the “one step ahead” final forecast versus the statistical forecast. Note that the report is sorted from lowest to highest values of the FVA vs. Statistical column, so the first row shows the item (Total>Cakes>Food-King>CH-20-01) that lost the most accuracy in your forecasting process.
Experiment with the report settings until you are comfortable with their operation. Click OK to exit the Settings dialog box when you have finished and then exit the program without saving changes to the Tutorial – Exception Reporting project.
This concludes the Exception Reporting lesson.

