Select Clear all filters on the hamburger menu to clear your filter selections.
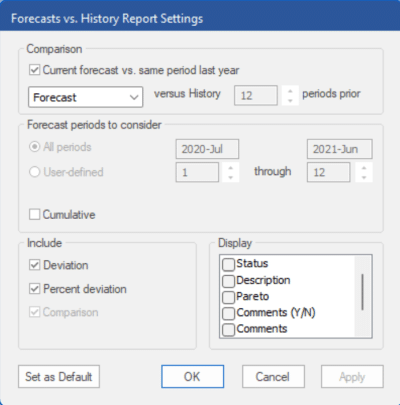
Let’s take a closer look at the dialog box for the Forecast vs. History report. Right click on the exception report to invoke the context menu and select Settings.
The Comparison section at the top of the dialog box is where you define the type of Forecast(s) you want to use (Baseline, Forecast, Statistical) and number of periods prior we want to compare to. By default, the report is showing the current forecast versus the same period last year for all periods in the forecast horizon.
The Forecast periods to consider section allows you to set the number of forecast periods to monitor and to specify if you want to look at each individual period or at the cumulative total across the specified forecast periods. The default setting (cumulative is not checked) monitors all forecast periods individually.

Let’s compare the cumulative forecast for the next 3 months to the cumulative history for the corresponding 3 months last year. Uncheck Current forecast vs. same period last year to activate the User defined radio button and customize the comparison periods. Select User defined and change the defined span to read 1 through 3. Check the Cumulative checkbox.
The Include section allows you to specify which statistics you want to show in the report. By default, the report shows Deviation and % Deviation. We will keep the defaults. Click the OK button.

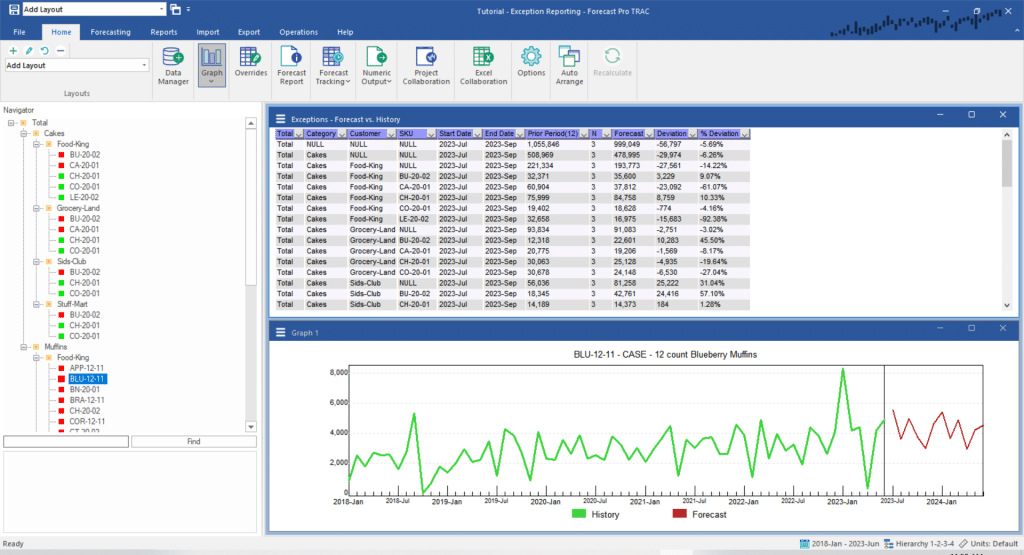
Notice that the report has updated to reflect the new settings. Columns are added to show the start date and the end date for the cumulative period. The newly added N column to the right of Prior Period(12) shows the number of prior periods that are included in the historical cumulative value. If historical values are not available for all periods in the cumulative period, N will be the number of periods with available data.

