In this exercise we will perform the following steps:
- Use the Detection only mode to identify the outliers.
- Use the Outlier Report view and the Graph view to review the detected outliers and determine whether a correction is warranted.
- Use the \OUTLIER=CORRECT modifier to correct the outliers that we feel should be corrected.
On the Home tab, click the Data Manager icon to call up the Data Manager.
Click the Add drop-down on the Historic Data row, select Excel and select 123 Bakery – Historic Data.xlsx to add it to the Historic Data row.
Click the Read & Forecast button to read in the historic demand data and generate the statistical forecasts.
Click the Exit button to exit the Data Manager.
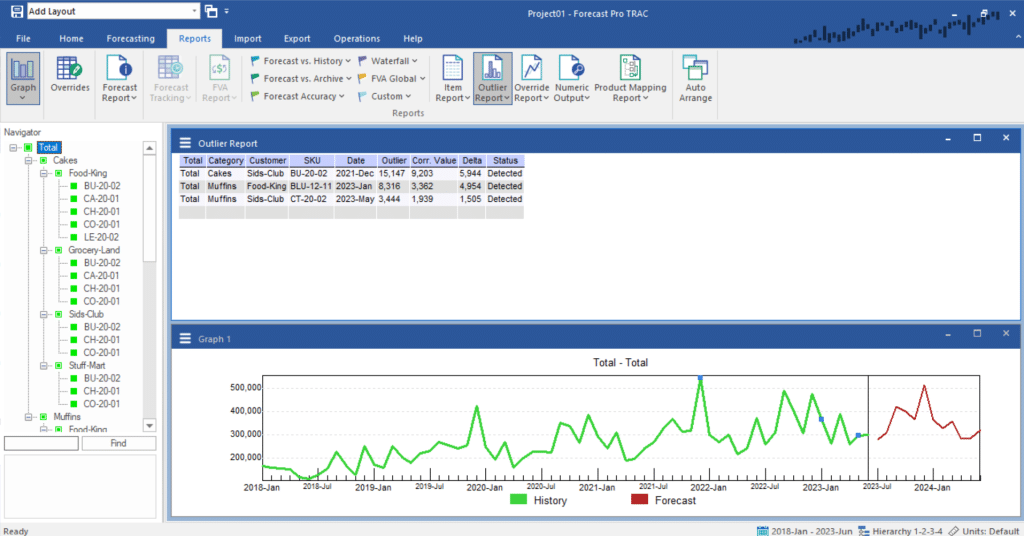
Fully expand the Navigator. Select the Reports tab and click the Outlier Report icon to open the outlier report view. From the Home tab, click the Overrides icon to turn off the Override view and click the Auto Arrange icon on the Home tab or on the Quick Address Toolbar to create the display below.

Notice that a total of 3 outliers have been detected, and their current Status is Detected.

