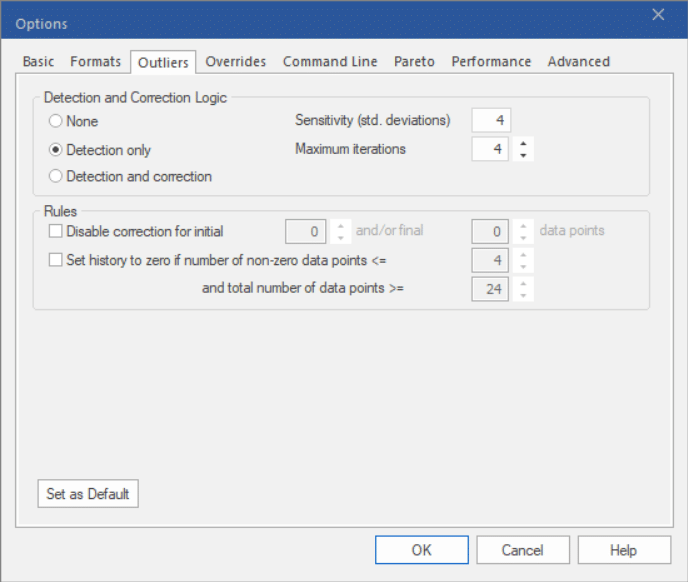
Start Forecast Pro and open a new project. On the Home tab, click the Options icon to open the Options dialog box and display the Outliers tab.

There are three modes for outlier detection and correction.
None turns outlier detection and correction off. This is the default and many Forecast Pro users do not use (nor need to use) outlier detection.
Detection only will detect outliers and display the suggested corrected values, however, the forecasts will be generated using the uncorrected history.
Detection and correction will detect outliers and will automatically use the corrected values when generating forecasts.
The detection and correction algorithm works as follows:
- The specified forecasting model is fit to the time series, the residuals (fitted errors) are generated and their standard deviation is calculated.
- If the size of the largest error exceeds the outlier threshold, the point is flagged as an outlier and the historic value for the period is replaced with the fitted value.
- The procedure is then repeated using the corrected history until either no outliers are detected, or the specified maximum number of iterations is reached.
In a multiple-level problem the detection is only performed on the end items (i.e., the nongroup level). If the correction option has been selected, after all end items are corrected, the group level totals are reaggregated to reflect the corrected values.
You can adjust the Sensitivity setting to make the outlier threshold more or less sensitive. The proper setting will depend on the stability of your data set.
Set the detection and correction mode to Detection only, make sure the other settings match the selections shown above and click OK.

