By default, the Graph view is “context sensitive” meaning that when you change your selection on the Navigator, the Graph view is immediately updated to display your current selection.
There may be times when you wish to graph multiple Navigator items on a single graph. In our current example, it might be interesting to view a single graph showing customer-level sales of cakes for our four customers so we can get a feel for the relative sales volumes.
Forecast Pro opens up to five Graph views simultaneously. Open a second graph view by selecting the Graph icon drop-down menu and selecting “Add graph.” Click the Auto Arrange icon to tile the display.
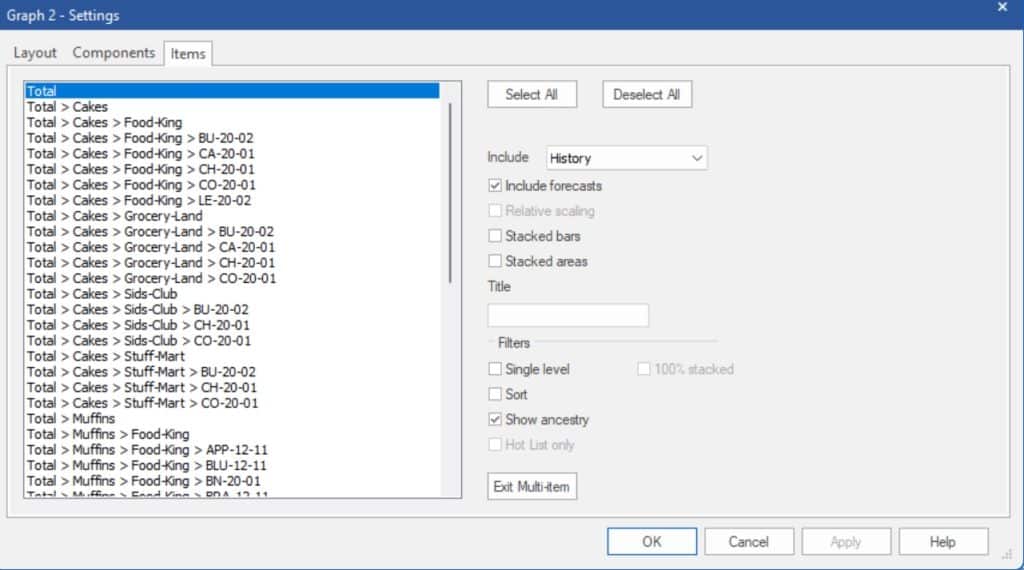
Open the Graph 2 Settings dialog box by right clicking on the Graph 2 view to bring up the Graph context menu and selecting Settings. Select the Items tab.

The Items tab on the Graph Settings dialog box allows you to select up to five items to graph together. The graph will include the history and/or forecast for each selected item using separate lines (default), stacked bars or stacked lines.
Click the Deselect All button to clear existing selections. Hold down the [Ctrl] key and click on each of the following items to highlight them:
Total>Cakes>Food-King
Total>Cakes>Grocery-Land
Total>Cakes>Sids-Club
Total>Cakes>Stuff-Mart
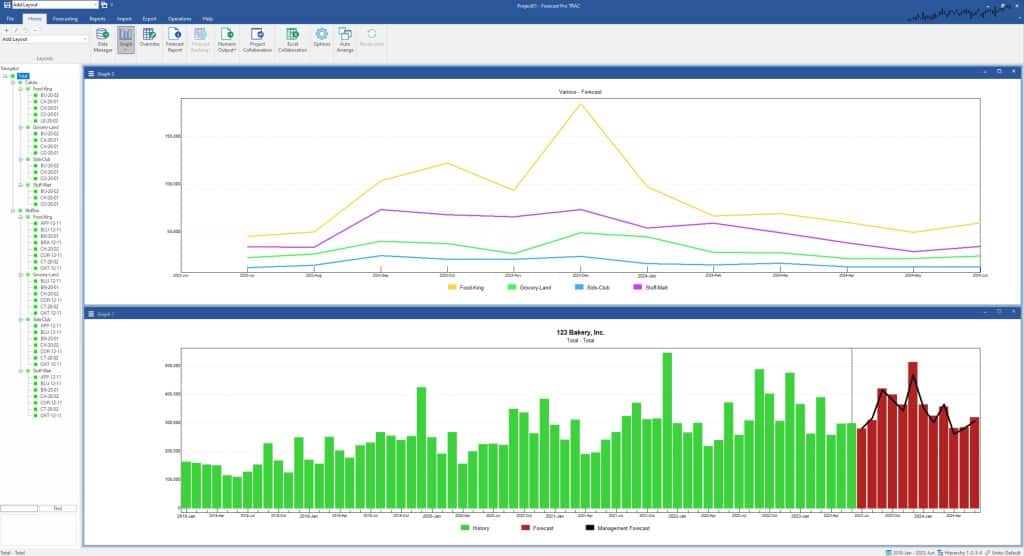
Open the Include drop-down and select None to limit our graph to the forecasts. Make sure Relative Scaling is turned off. Click OK. Your screen should look like the one below.

Close Graph 1 and click Auto Arrange to maximize the Graph 2 view. Notice that Food-King is clearly our largest customer, followed by Stuff-Mart, Grocery-Land and Sids-Club.
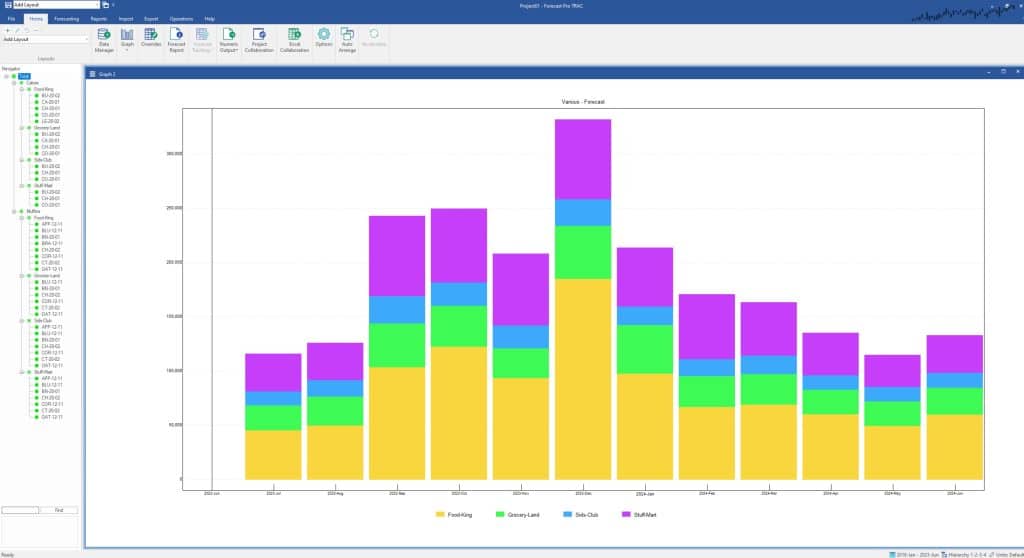
Suppose we want to change the view to a stacked bar graph. Re-open graph settings, go to the Items tab and check the Stacked bars checkbox. Click OK.

Note that the height of each bar is now Total Cake sales for each forecast period and the stacked bars show the relative contribution of each customer.
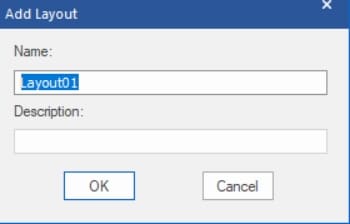
Let’s create a layout so that we can easily restore this multiple graph view. Click the Add icon (![]() ) in the layouts section on the far left of the Home tab. Enter “Customer Forecast” in the Name textbox on the Add Layout dialog.
) in the layouts section on the far left of the Home tab. Enter “Customer Forecast” in the Name textbox on the Add Layout dialog.

Click OK. Notice that the Layout drop-down now shows Customer Forecast. This indicates that the Customer Forecast layout is currently active.
Click on the Graph icon to re-open Graph 1. The Layout drop-down is updated to “Add Layout,” indicating that there is not a currently active layout. Select Customer Forecast on the Layout drop-down to restore the multi-item graph view we created earlier.
Exit the program without saving changes. This concludes the Customizing Graph Views lesson.

