Working with end-items
Start Forecast Pro and create a New Project.
Make sure you are on the Home tab and click the Data Manager icon.
Click the Add drop down on the Historic Data row, select Excel and select 123 Bakery – Historic Data.xlsx to add it to the Historic Data row. Click on the Read & Forecast button and then on the Exit button to close the Data Manager.
Right click in the Navigator to open the context menu and select Expand All. In the Navigator, select Total>Cakes>Food-King>BU-20-02.
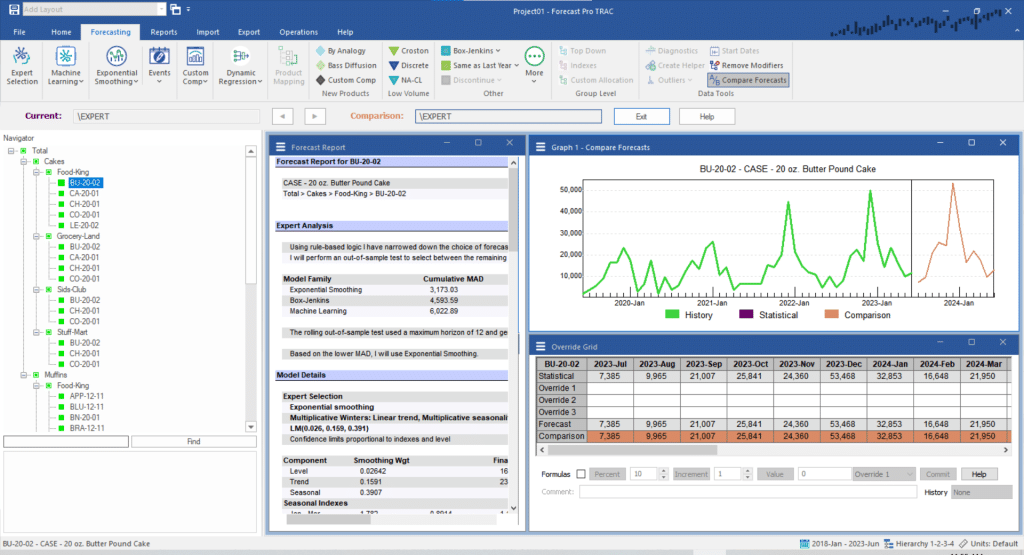
Select the Forecasting tab and select the “Compare Forecasts” button.

Note the dialog bar that appeared below the ribbon bar with two text boxes. The text box labeled Current shows the forecasting modifier(s) that Forecast Pro is currently using, and the Comparison text box shows a potential alternative. In this case, the current and comparison are the same.
There are also two arrow buttons. The left arrow is used to make the comparison forecast modifier(s) the current statistical forecast. The right arrow will copy the current forecast modifiers(s) into the Comparison textbox and use it as the comparison model. This is useful if you know that you want to maintain some of your current modifiers (e.g. Leadtime modifiers) if you decide to commit to the comparison statistical forecast.
You will also notice a new row in the Override Grid highlighted blue and named “Comparison”, which includes the comparison forecast values. There is also a blue comparison line added to the graph, and the Forecast Report window now contains a comparison of the two models.
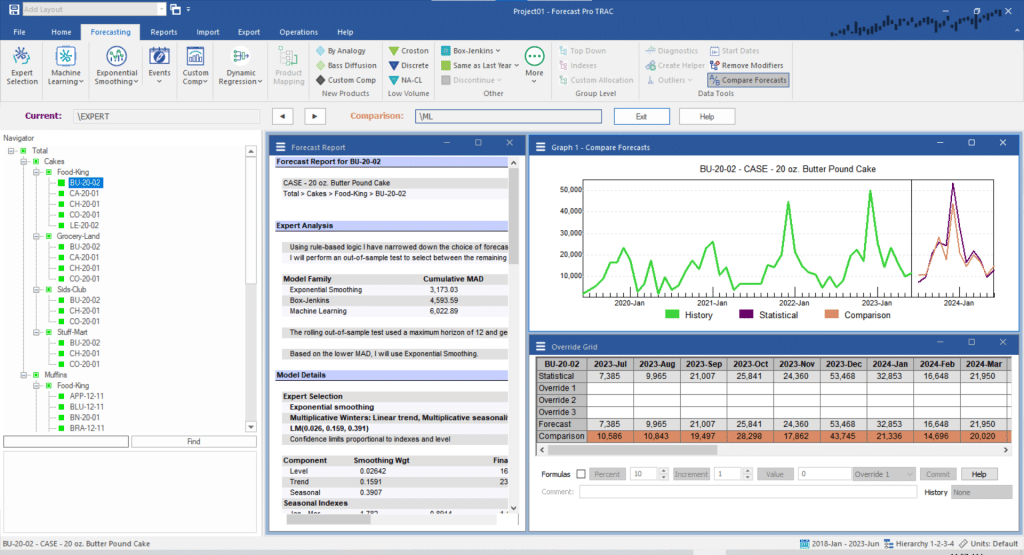
Select “Machine Learning,” and you will notice that the graph now has two distinct lines, with the current shown in purple, and the comparison shown in blue.

Click the left arrow to make Machine Learning the current model. Note that the statistical row in the Override Grid has changed, and the Current and Comparison now match.
Working with groups
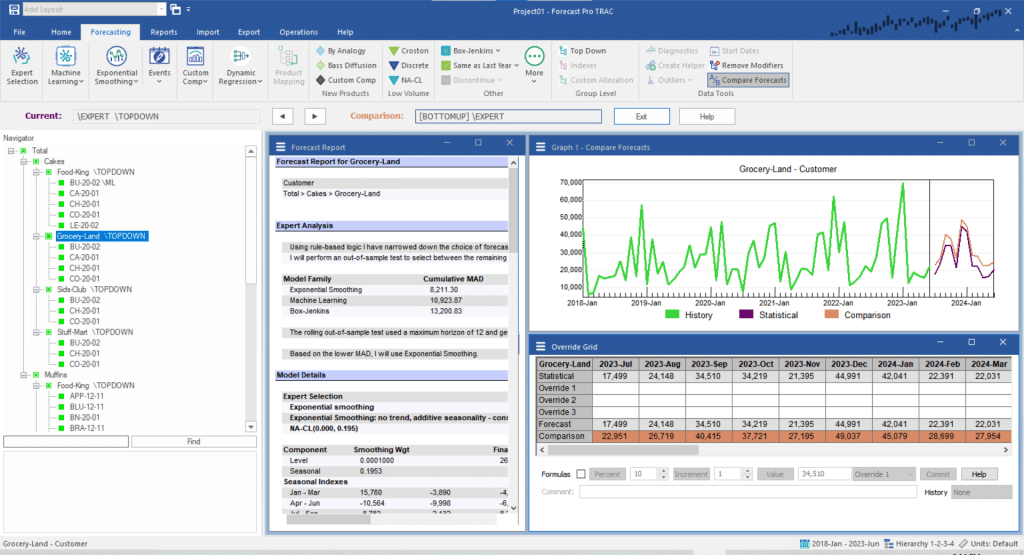
In the Navigator, select Total>Cakes>Food-King. Note that the Current text box has a “[BOTTUMUP]” disclaimer, indicating that the current statistical forecast is a sum of the forecasts of the lower levels. More details can be found in Working with Hierarchies. Click the “Top Down” button. Note that the Comparison has changed to include the \TOPDOWN modifier and the Comparison values in the Graph and Override Grid have changed. Click “Expert Selection” in the tool bar and notice that the values for the Comparison model (\EXPERT \TOPROWN) are different from the Current model ([BOTTOMUP] \EXPERT). Click the left arrow to make \EXPERT \TOPROWN the current model. Notice that there is now a \TOPDOWN modifier applied to Food-King.
Select Total>Cakes>Food-King>BU-20-02 in the Navigator. The \TOPDOWN modifier was removed from the Comparison (because this modifier can only be applied to groups). The Current and Comparison models both now show a “[TOPDOWN]” disclaimer to indicate that you are looking at a member of a top down group, and both the current and comparison forecasts will be adjusted accordingly.
Click the Exit button in the Compare Forecasts dialog bar and select Total>Cakes>Food-King in the Navigator. Right click in the Navigator to open the Context Menu and hover your cursor over “Apply Modifier(s) To” and select “This Level.” Notice how all the customers now have a “\TOPDOWN” modifier.

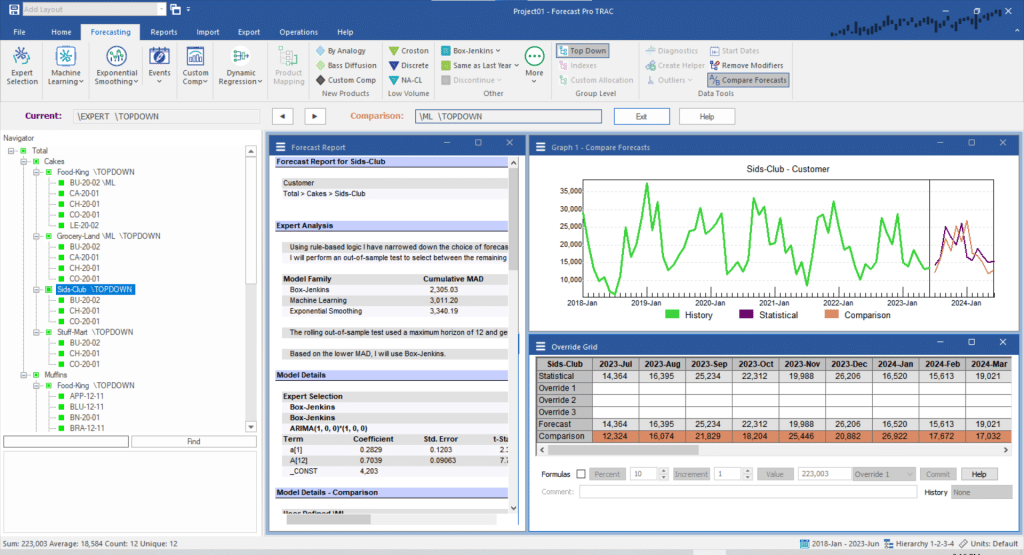
In the Navigator, select Total>Cakes>Grocery-Land and select “Compare Forecast” again. Note that the Comparison forecast is Bottom Up by default. Use the right arrow to apply the \TOPDOWN modifier to the Comparison. Notice that now the Current and Comparison match. Select Machine Learning to change the Comparison to a top down machine learning model.

Click the left arrow to use the Comparison model as the statistical forecast. In the Navigator, select Total>Cakes>Sids-Club. Notice that the Comparison model is still a top down machine learning model. If you prefer the \ML \TOPDOWN model to the current model for Total>Cakes>Sids-Club as well, click the left arrow to make it the current model.
Click the Exit button to close the Compare Forecast utility.

