In this section we will be forecasting monthly sales of a nationally advertised brand of mouthwash.
Start the program, select New Project and, on the Home tab, click the Data Manager icon to open the Data Manager. Click the Add drop-down on the Historic Data row, select Excel and select Minty Fresh Mouthwash – Historic Data.xls to add it to the Historic Data row.
Click the Add drop-down on the Helpers row, select Excel and select Minty Fresh Mouthwash – Helpers.xls to add it to the Helpers row. This file contains an event schedule indicating the months where the mouthwash was price promoted.
Click the Read & Forecast button to read in the historic demand data and generate the statistical forecasts.
Click the Refresh button on the Helpers row to read in the event schedule.
Click the Exit button to exit the Data Manager.
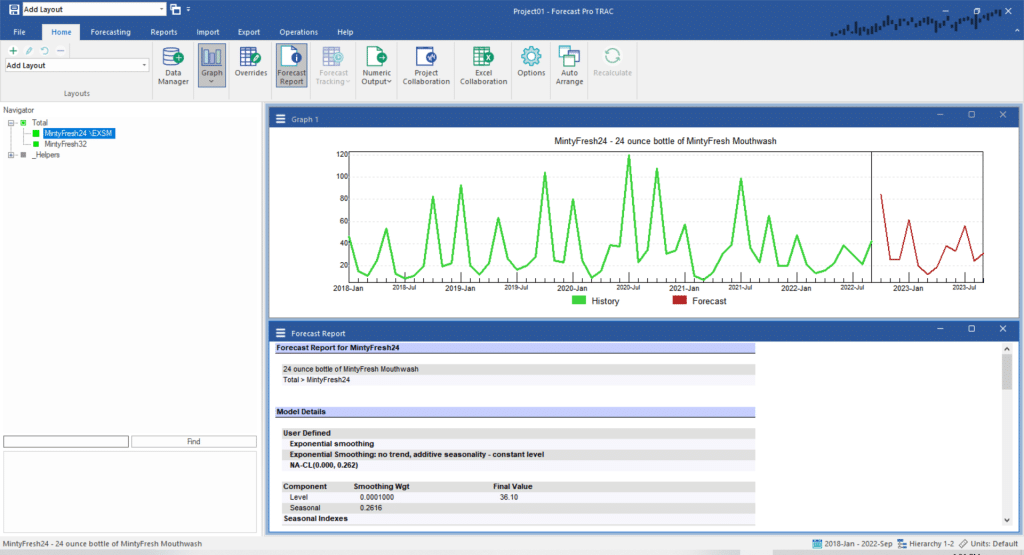
Close the Override view and open the Forecast Report view by clicking the Forecast Report icon on the Home tab. Right click on the Navigator to invoke its context menu and select Expand all to fully expand the Navigator. Select MintyFresh24 on the Navigator. Then, select Exponential Smoothing under the Forecasting tab, and move back to the Home tab. Your display should now match the one shown below.

The prominent peaks in the historic demand (green line) on the graph are not due to seasonal patterns. Instead, they are the result of price promotions. Select MintyFresh24 on the Navigator. This series represents sales of the same product in a different size package. PriceSpecials is an event variable—we will discuss this variable shortly.
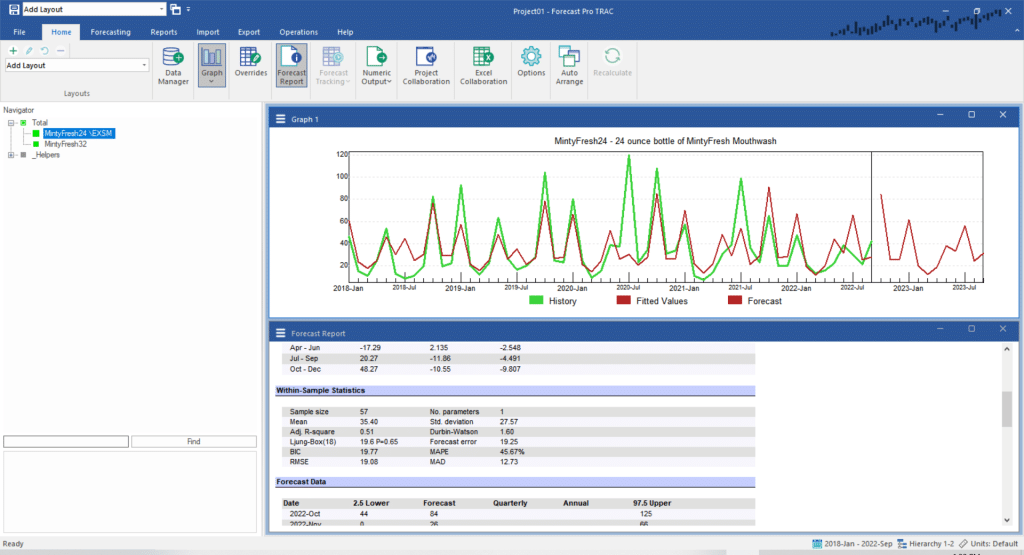
View the Forecast Report for MintyFresh24 and notice that the adjusted R-square is 0.51. Exponential smoothing recognized the effects of the promotions as a form of irregular seasonality. The forecasts from such a model tend to repeat the promotional pattern of the last year of historic data. If, as is usually the case, your future promotions are patterned differently, the forecasts may be very bad.

Include the fitted values on the graph. (This is accomplished by toggling on Fitted on the graph’s context menu). Notice that the model predicted several peaks that did not occur as well as missing several that did. The model is trying to capture the peaks as part of the seasonal pattern. However, the promotions that caused these peaks did not always fall in the same months and thus cannot be modeled using a seasonal model.
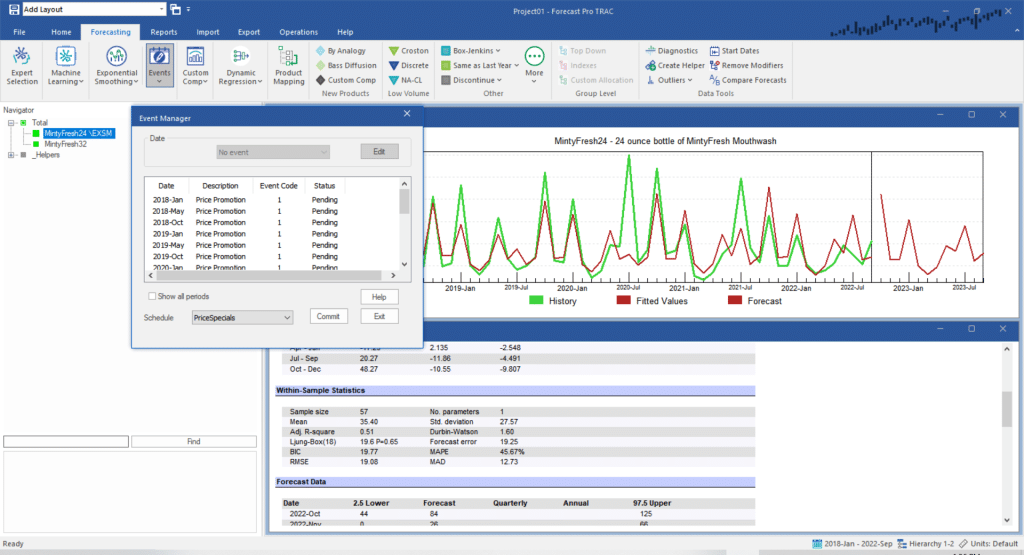
Select the Forecasting tab. Click on the Events icon to open the Manage Events dialog box. Use the Schedule drop-down located at the bottom of dialog box to select the PriceSpecials schedule.
The PriceSpecials schedule uses Event Code 1 to indicate periods where the product was on promotion. Notice that the dates listed correspond to the strong peaks in the data and include two points during the forecast period where a promotion is scheduled.
Before we generate the forecasts, let’s add a description for Event Code 1. Click the Edit button to open the Manage Event Codes dialog box. The Event Code 0 is always used to indicate no event occurred. Therefore, it is predefined and No Event already appears as the description. Select Event Code 1 in the lower section of the dialog box and then edit the description displayed for Event Code 1 to read Price Promotion and click the Add button. Notice that the description is updated with a status of “Pending.” Click the Commit button to accept the new description and then the Exit button to return to the Manage Events dialog box.

Click Commit to generate the event model forecasts.
Examine the Forecast Report for MintyFresh24. Notice that an exponential smoothing model was used and that the model includes an event smoothing weight. In addition, notice that the adjusted R-square is now 0.79.
The graph reveals a much better fit to the data and forecasts strong peaks that correspond to the months indicated as promoted.
Notice that on the Navigator MintyFresh24 now appears with a “\EVENT=PriceSpecials” modifier to indicate that an event model was specified. Select Apply Modifier(s) to on the Navigator’s context menu and select All Items. This will specify that event models using the PriceSpecials schedule should be built for every item on the Navigator. In this example, this is appropriate since the same promotional schedule was used for both MintyFresh24 and MintyFresh32.
If the two products had been promoted differently, we would have created two separate event schedules.
Exit Forecast Pro.

