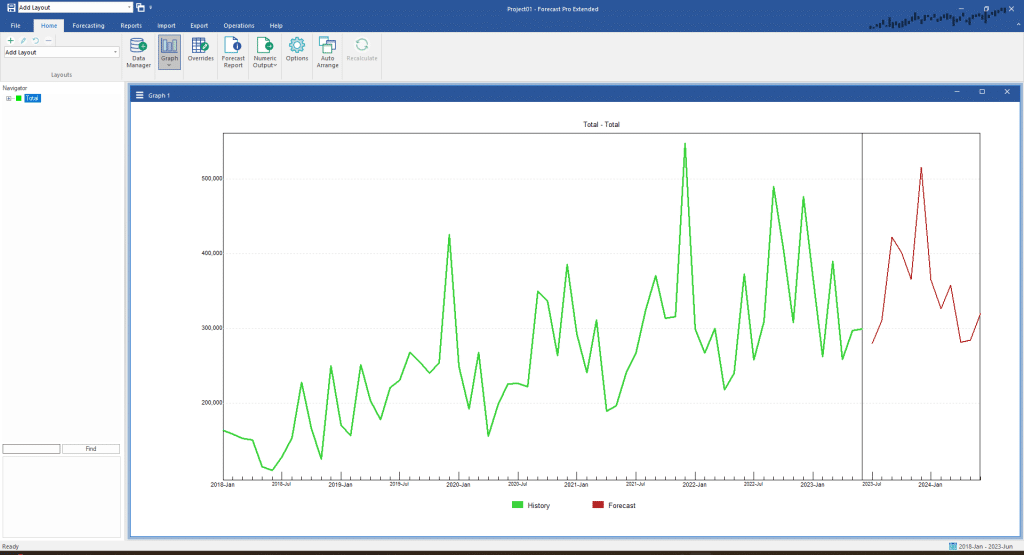
Click the Overrides icon to close the Override view and click the Auto Arrange icon to maximize the Graph view. Since Total is selected on the Navigator, the graph displays Total.

The green line in the Graph view is the historic demand and the red line is the forecast. Move the cursor to a point on the graph and click the left mouse button. Notice that the display now includes a vertical red line and a box listing the corresponding date and numeric values of the graph variables.
Click January 2020 (the months are marked along the x-axis). Notice that the red line and box have moved to the new location.
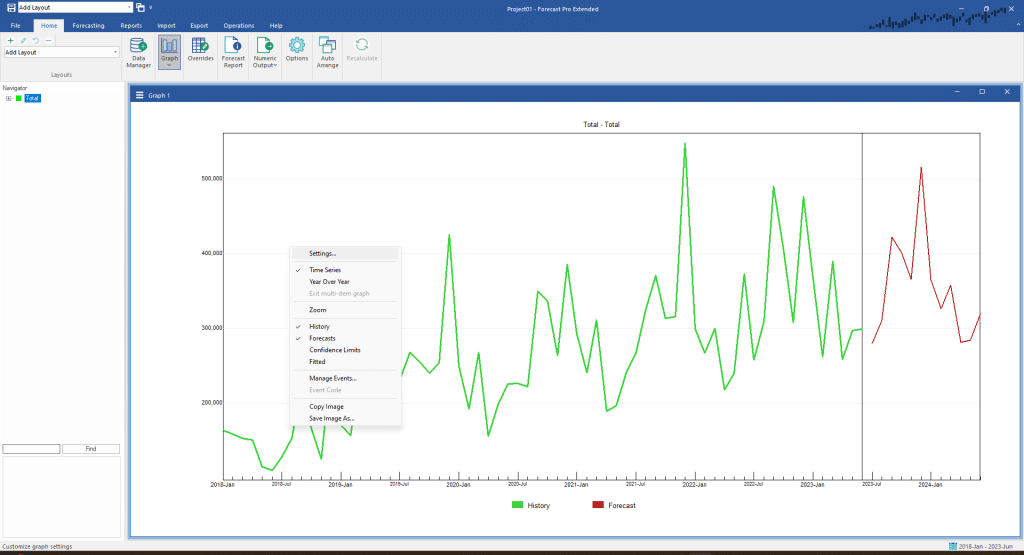
Click the right mouse button to invoke the Graph view’s context menu. Notice that multiple graph components (History, Forecast, Confidence Limits and Fitted Values) can be toggled on or off.

Select Forecasts to uncheck and turn off the forecast. Select Forecasts a second time to turn the forecast back on.
The Graph view can be customized using Settings on the context menu to adjust the data display (e.g. colors, graph type, titles), edit the data shown on the graph, or display multiple items. Settings can also be accessed by clicking on the three horizontal lines on the upper left corner of the graph view. We will explore Forecast Pro’s graphing functionality in more detail in another lesson.
Double-click Total on the Navigator to expand the Navigator’s tree. You’ll see that the total sales breakdown into Cakes and Muffins. Select Total>Cakes on the Navigator. Notice that the Graph view is immediately updated to match our current selection.
If you expand Total>Cakes on the Navigator, you’ll discover a customer-level breakdown and finally a SKU level breakdown. Experiment with the Navigator until you are comfortable with its operation. In the next lesson, we’ll show you some shortcuts for navigating complex hierarchies.
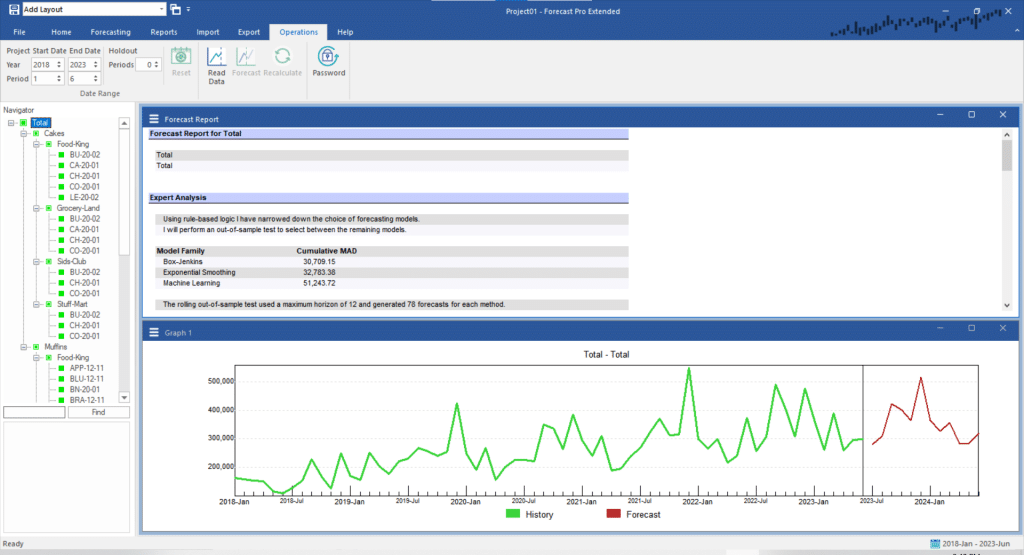
After you have explored the data, click on the Forecast Report icon to open the Forecast Report view. Click the Auto Arrange icon and select the Operations tab so that your display matches the one shown below.

The Date Range group on the Operations tab displays the earliest and latest period found for the entire historic data set. Note that this date range is also displayed on the status bar. The ending date is very important. If an individual item has data on the ending date, the item is active and will be forecasted. If an item’s history ends prior to the ending date, the item is inactive and will not be forecasted. If you do not adjust the starting or ending dates Forecast Pro will prepare forecasts using all available data for each active series.
For this example, we used expert selection to create the forecasts. Expert selection is the default method. Expert selection can be thought of as an automatic pilot. It analyzes your data statistically to determine the best forecasting technique to use and then proceeds to build the forecasts.
Expert selection begins by running a series of statistical tests on the data. The results of these tests are run through an AI-driven rule-based expert system. At times the expert system will directly select an appropriate forecasting method. At other times the rule-based logic will narrow down the potential forecasting methods that could be used without producing a clear winner. In these instances, expert selection will use an out-of-sample test to select between the competing models.
The Expert Analysis section of the Forecast Report documents how Forecast Pro makes its decision. In our example, the rule-based logic for Total>Cakes>Food-King>BU-20-02 was inconclusive but narrowed down the choices to either an exponential smoothing model, a Box-Jenkins model or a machine learning model. An out-of-sample test was then used to choose between these three candidates.
Notice that the expert system acts in much the same way as an expert statistical analyst. It performs a series of statistical tests, interprets the results, performs more tests if necessary and finally makes recommendations based upon the results.
Expert selection works well for most applications. However, Forecast Pro also allows you to customize your forecasting approach by adding modifiers to the Navigator. A modifier on a particular item gives Forecast Pro instructions on how to create the forecasts for that item. We explore the use of modifiers in Customizing Forecasts.

