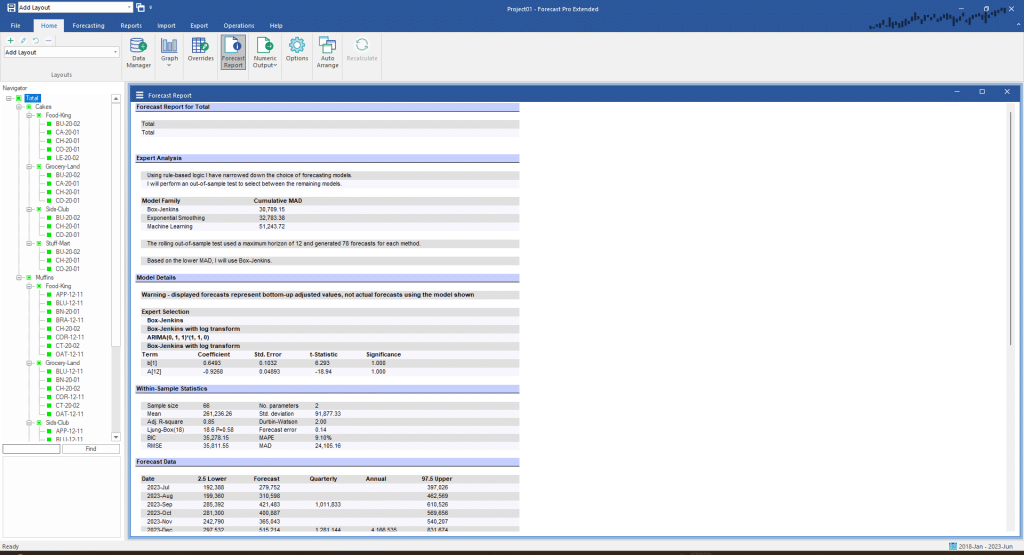
Let’s take a closer look at Forecast Report view. Return to the Home tab, turn off the Graph view by clicking the Graph Icon and click the Auto Arrange icon.

You are currently looking at a standard format Forecast Report. The Forecast Report can be customized and can include up to thirteen sections. They are:
- Expert Analysis documents the logic behind the expert selection’s decision. This section will be omitted if a user-specified forecasting model is used.
- Model Details documents the specific forecasting model that was used to generate the forecasts.
- Within-Sample Statistics provides a set of standardized model statistics that can be used to diagnose the current model as well as to compare and contrast alternative forecasting approaches.
- Variable Specification Test Battery (not currently active) provides test statistics for explanatory variables to add to a regression model. This is only available when dynamic regression is used.
- Dynamics Test Battery (not currently active) provides test statistics for dynamic terms to add to a regression model. This is only available when dynamic regression is used.
- Correlation Matrix (not currently active) shows the correlation coefficient between each set of explanatory variables in a regression model. This is only available when Dynamic Regression is used.
- Covariance Matrix (not currently active) shows the covariance between each set of explanatory variables in a regression model. This is only available when Dynamic Regression is used.
- Historic Data (not currently active) lists the history and fitted values along with some aggregated totals and summary statistics.
- Forecast Data lists the forecasts and confidence limits along with some aggregated totals and summary statistics.
- Safety stocks lists the safety stocks for different lead times along with the demand during lead time and reorder point.
- Out-of-Sample Rolling Evaluation and Out-of-Sample Static Evaluation (not currently active) list the out-of-sample statistics that are generated when a holdout analysis is performed.
- Outliers (not currently active) lists any detected and/or corrected outliers.
- Overrides displays any overrides and/or comments that were entered.
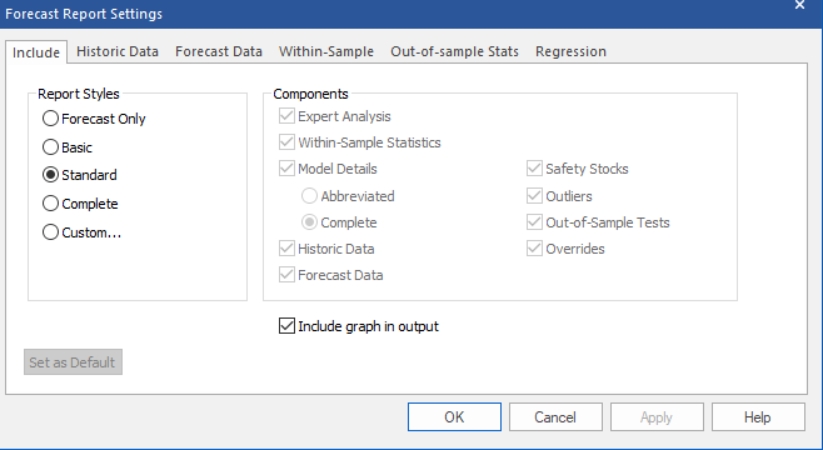
Select Settings on the Forecast Report view’s hamburger menu to invoke the Forecast Report Settings dialog box shown below. Notice that this dialog box allows you to select a standardized report style or create a custom one.

Select Forecast Only and click OK. Notice that this report is much simpler that the Standard one. Return to the Forecast Report Settings dialog box and experiment with the settings. After you are comfortable with their operation edit the settings to display the Standard report style and click OK.

