There will undoubtedly be times when you want to judgmentally override the statistical forecasts. For instance, you may know of a large incoming order and need to change a number or two. Forecast Pro allows you to make these changes quickly and easily.
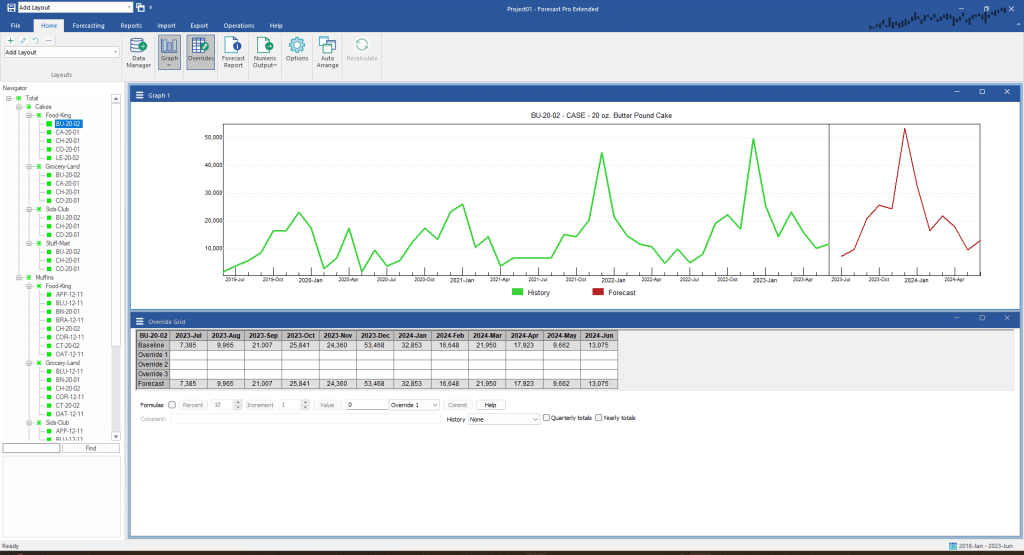
Select Total>Cakes>Food-King>BU-20-02 on the Navigator. Click the Overrides icon to open the Override grid, close the Forecast Report view by clicking the Forecast Report icon and open the Graph view by clicking on the Graph icon. Click the Auto Arrange button. Your display should look like the one below.

The default Forecast Override view display contains a row for the statistical forecast, three override rows and a row for the current forecast. Forecast Pro allows you to include up to 10 override rows. Dedicating different override rows to different types of adjustments and labeling them appropriately is an excellent practice.
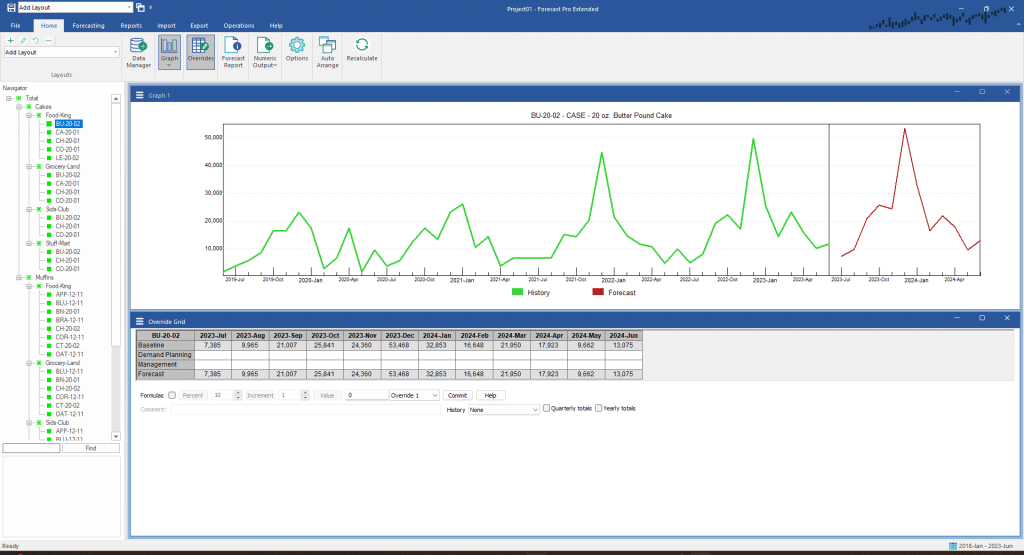
Right click the row labeled Override 1 to invoke the context menu. Notice that this menu allows you to add or remove override rows, edit the row labels, set the precision of the numbers displayed and control whether a thousand’s separator should be used. Select Edit Row Label and rename Override 1 “Demand Planning.” Right click the row labeled Override 2 and use Edit Row Label to rename it “Management.” Right click the row labeled Override 3 and use Remove Row to remove it from the display. Your screen should now look like the one below.

There are several different ways to override the statistical forecasts. You can enter values in individual override cells, you can select a range of cells and use the Percent, Increment or Value buttons to write the desired overrides to the target override row, or you can use the mouse to drag points on the graph. If a time period has overrides in both Override 1 and Override 2, Override 2 will take precedence.
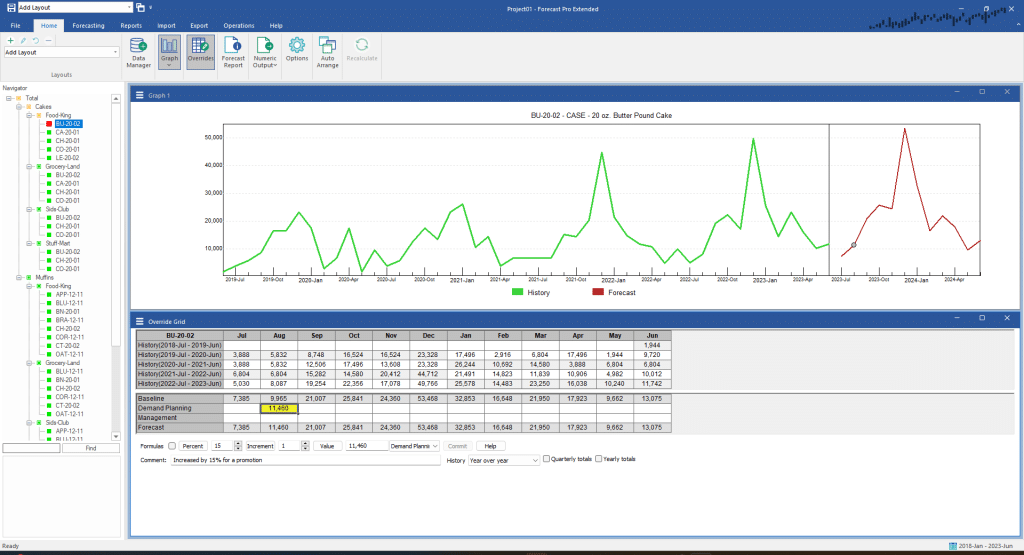
Select the Baseline cell for August of 2023. Enter a 15% override for August by updating the Percent field to 15 and clicking the Percent button. Notice that the proposed overrides are written to the target row indicated to the immediate left of the Commit button—in this example, Demand Planning.
Notice also that the values displayed in the Forecast row have not changed—this is because we have not yet committed to the overrides. Uncommitted overrides are displayed in red, both in the override row and on the graph. Click the Commit button to accept the overrides. Notice that the formerly uncommitted values in the override row change to black, the Forecast row is updated, and the graph is updated.
Click on the August Demand Planning cell. In the comment field, enter “Increased by 15% for a promotion”. Click the Commit button. Note that the cell is now yellow to show that there is a comment associated with the cell.
Click on the History dropdown and select Year over year. Note that the display now includes your historic data.

Notice that the icon for Total>Cakes>Food-King>Bu-20-02 on the Navigator now appears in red and the icons for Total>Cakes>Food-King, Total>Cakes and Total in yellow. A red Navigator icon signifies that an override has been made to the item. If a group icon appears in yellow, it signifies that an override has been made to a variable lower down that branch of the hierarchy.
When you make an adjustment to an item in a hierarchy, Forecast Pro will automatically reconcile the entire hierarchy to reflect the change. When we made our override to Total>Cakes>Food-King>Bu-20-02 this impacted the groups above our selection. The Reference section of this manual describes how the reconciliation is performed.
When you make an adjustment to an item in a hierarchy, Forecast Pro will automatically reconcile the entire hierarchy to reflect the change. Thus, when we made our override to Total>Cakes>Food-King>Bu-20-02 this impacted the groups above our selection. If we made an override to a group (e.g., Total>Cakes>Grocery Land), then all groups above and all items below our selection would be impacted. Understanding how forecast overrides are allocated describes how the reconciliation is performed.
Important: If you restrict your overrides to a single level of the hierarchy, the reconciliation process is simple and intuitive. We strongly urge you to limit your overrides to a single level, if at all possible.
Turn off the Override Grid by clicking the Overrides icon or explicitly closing the view window.

