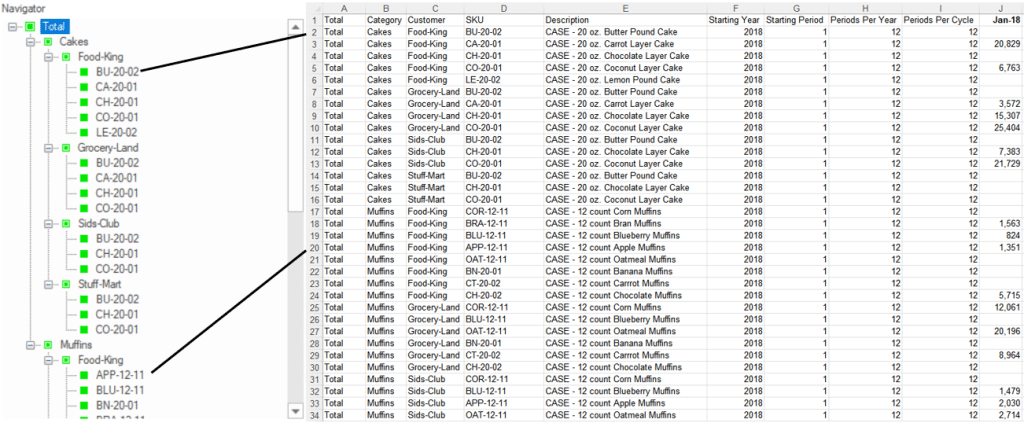
Open 123 Bakery – Historic Data.xlsx in Excel.

Note that the historic data is on the first worksheet of the Excel workbook. Forecast Pro assumes the data reside in the first (topmost) worksheet unless an alternate sheet has been specified by naming it “BFSData”.
Row 1 of the worksheet is devoted to column headings. The keyword “description” must be used as the column heading for the description column. The other cells in row 1 are ignored by Forecast Pro. You can use them for titles, calendar information, etc.
Subsequent rows contain the data for each end item to be forecasted. Notice that group-level data is NOT included in the spreadsheet. The group-level data is created by Forecast Pro when you read in the end items.
The columns in 123 Bakery – Historic Data.xlsx are structured as follows:
- A-D Attributes in the defined hierarchy. When the data is read into Forecast Pro, the attributes define the item names and the hierarchy displayed in the Navigator. For example, the first item (row 2) will be identified as Total>Cakes>Food-King>BU-20-02. Attributes are described in more detail in the Defining the Hierarchy.
- E Variable description. This column must be labeled Description.
- F Starting year. This field must be an integer. The Bakery data starts in 2018 for all data rows.
- G Starting period. This field must be an integer. The Bakery data starts in January, so the column is 1 for all data rows.
- H Periods per year. This field must be an integer. Since the Bakery data is monthly, this is 12 for all data rows.
- I Periods per seasonal cycle. The length of the seasonal pattern. This field must be an integer. For monthly and weekly data, this is typically the same as periods per year.
- J-BW Historic Data values from January 2018-June 2023. Column J contains the first data point in the series which corresponds to January 2018, based on the values in columns F and G (not the column label in J1). Each row is the historic data series for the item described by the attributes in columns A-D. For example, sales for Total>Cakes>Food-King>CA-20-01 was 20,829 in January 2018.
When Forecast Pro reads in a spreadsheet it uses the starting year, starting period and the presence of historic data to determine when each end item starts. Notice that 123 Bakery – Historic Data.xlsx uses the same starting year and starting period for all end items and then uses blank cells to “pad” the end items that don’t start on January of 2018. This is not the only way you can establish the starting dates for each series but is the recommended way when using a spreadsheet.
In the next section we will explore some of the settings in Forecast Pro that pertain to reading in data. We will see that some of these settings control how blank cells and zeroes are interpreted, allowing you to set up your data in different ways. These settings can also control whether an item is active and will be forecasted or if it is discontinued and will not receive a forecast. There is a big difference between a product not being available (e.g., the product hasn’t launched yet or has been discontinued) and a product being available but having zero demand in a given period (e.g., the product was available—we didn’t sell any). Therefore, it is very important that you understand how Forecast Pro interprets blank cells and cells containing zeroes when setting up your data.

