Start the program, select New Project and click the Data Manager icon to call up the Data Manager. Click the Add drop-down on the Historic Data row, select Excel and select ACME Hardware – Historic Data.xlsx to add it to the Historic Data row.
Click the Read & Forecast button to read in the historic demand data and generate the statistical forecasts.
Click the Exit button to exit the Data Manager.
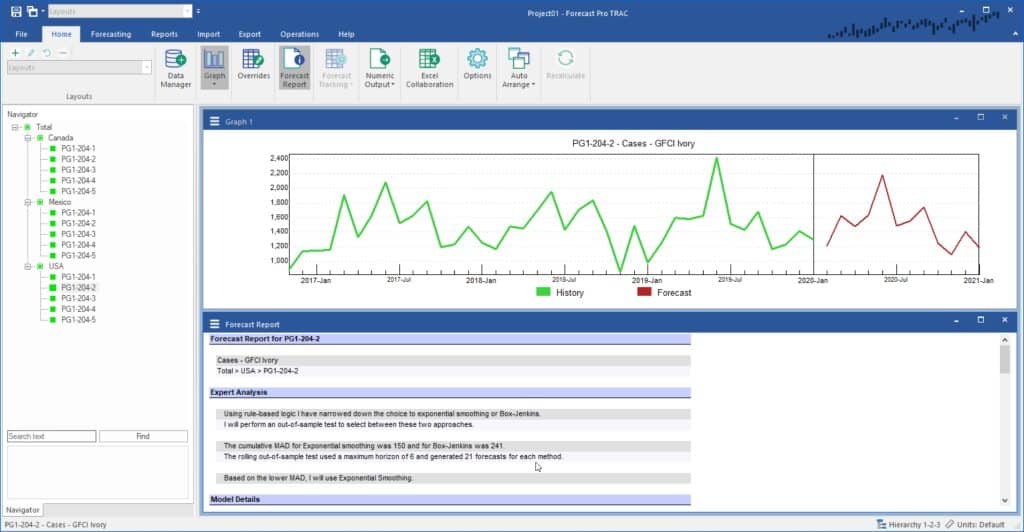
Fully expand the Navigator using the Expand All option on its context menu. Close the Override View and open the Forecast Report by clicking on the Forecast Report icon on the Home tab. Select Total>USA>PG1-204-2. Your display should now match the one shown below.

If you do not instruct Forecast Pro to use a specific forecasting technique it will use expert selection to select the appropriate technique for each item forecasted. If you examine Total>USA>PG1-204-2’s Forecast Report, you’ll notice that it includes an Expert Analysis section, and that expert selection chose to forecast this item using a machine learning model.
Suppose we want to use a Winters exponential smoothing model for this item. Winters is a form of exponential smoothing which includes both a trend and a seasonal component.
Select the Forecasting tab. Click on the Exponential Smoothing drop-down and select Winters. Alternatively, you may right click on Total>USA>PG1-204-2 to bring up the Navigator’s context menu and then select Model>Exponential Smoothing>Winters.

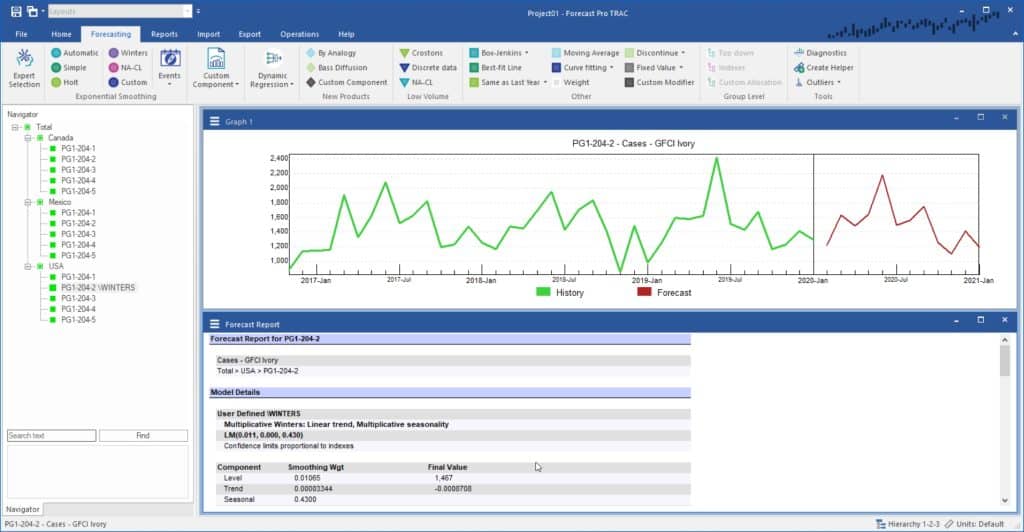
Notice that \WINTERS now appears next to Total>USA>PG1-204-2 on the Navigator. \WINTERS is a forecast modifier. In this instance, it is used to indicate that you have opted to use a Winters exponential smoothing model for this item rather than expert selection.
Examine the Forecast Report to verify that the Winters model was used. You’ll notice that the Expert Analysis section is no longer present and that the Model Details section indicates that a “User Defined \WINTERS” model was built.
Select Total>USA>PG1-204-4 on the Navigator. On the Forecasting tab, open the drop-down on the Same as Last Year icon (in “Other”) and select “Plus Percent”. Specify the percentage as “10” and click OK.
Notice that \SALYP=10 now appears next to Total>USA>PG1-204-4 on the Navigator. This model will set the forecasts to equal the same values as the preceding year plus 10%.

