Everybody forecasts, whether they know it or not. Businesses need to forecast future events to plan production, schedule their work force, or prepare even the simplest business plan.
Most business forecasting is still judgmental and intuitive. Sometimes this is appropriate. People must integrate information from a large variety of sources—qualitative and quantitative—and this is probably best done by using the extraordinary pattern recognition capabilities of the human brain. Unfortunately, many companies also use judgmental forecasting where they should not.
Not everyone understands the concept of forecasting. It tends to get mixed up with goal setting. If a company asks its salespeople to forecast sales for their territories, these “forecasts” often become the yardsticks by which they are judged.
The main advantage of statistical forecasting is that it separates the process of forecasting from that of goal setting and makes it systematic and objective. Statistical forecasting can help almost any business improve planning and performance. There is, in other words, value added for a business.
The future is uncertain, and this uncertainty can be represented quantitatively. Statistical forecasting represents uncertainty via a probability distribution. A probability distribution associates each possible outcome with a likelihood of it occurring. Two kinds of information are needed to describe the distribution: the point forecasts, which is essentially the “best guess” estimate, and the confidence limit, which captures how much uncertainty there is around the point forecast. The upper and lower confidence limits represent reasonable bounds for the forecast. You can be reasonably confident that the actual outcome will fall within the confidence limits.
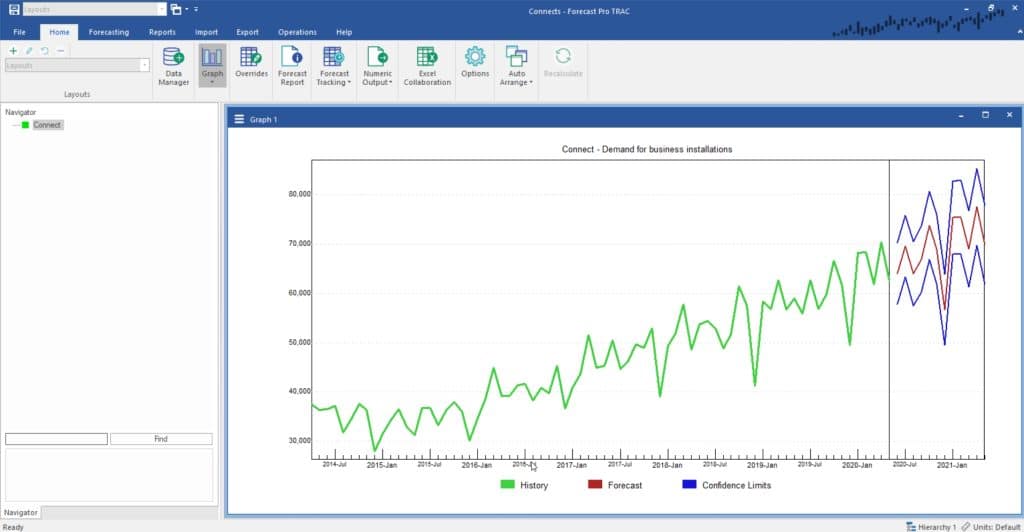
Forecast Pro depicts this information graphically as well as numerically. In the graph below, the red line represents the point forecast, while the blue lines represent the upper and lower confidence limits.

The upper confidence limit is often calibrated to the ninety-fifth percentile. This means that the actual value should fall at or below the upper confidence limit about 95% of the time. You can set the percentiles of both the upper and lower confidence limits. Sometimes, the upper confidence limit will be more useful for planning than the point forecast.
Let’s illustrate this idea with an example. Suppose you were in charge of forecasting widget sales for your company. If you wanted to determine expected revenues for next month, you would be most interested in the point forecast, since it is the mean value of the distribution. The point forecast gives you the minimum expected forecast error.
On the other hand, suppose you wanted to know how many widgets to produce. If you overproduce, warehousing costs will be excessive. But if you underproduce, you will probably lose sales. Since the cost of lost sales is usually greater than the cost of overstocking, you will be most interested in the upper confidence limit. The 95% upper confidence limit tells you how many widgets to produce to limit the chance of “stocking out” to less than 5%.
Some Forecasting Tips
Forecast Pro uses your data history to forecast the future, so it is extremely important that your data be as accurate and complete as possible. Keep in mind the rule, “garbage in, garbage out!”
You will also want to give some thought to what data you should forecast. If you want to forecast demand for your product, you should probably input and forecast incoming orders rather than shipments, which are subject to production delays, warehousing effects, labor scheduling, etc. Many corporations are making large investments to obtain data as close to true demand as possible.
The more data you can supply the program, the better. The program can work with as few as five data points, but the forecasts from very short series are simplistic and less accurate. Although collecting additional data may require some effort, it is usually worth it.
If your data are seasonal, it is particularly important that you have adequate data length. The automatic model selection algorithms in Forecast Pro will not consider seasonal models unless you have at least two years of data. This is because you need at least two samples for each month or quarter to distinguish seasonality from one-time irregular patterns. Ideally, you should use three or more years of data to build a seasonal model.

