

Right click on the graph to bring up the context menu and select Settings. Click on the Add or Remove button to bring up the Add or Remove dialog box and select Corrected History. Click on OK to close the Add or Remove dialog box. Make sure Corrected History is now included in the Layout tab of the Graph Settings dialog box and that the Display checkbox is selected. Click OK to close the Graph Settings dialog box.
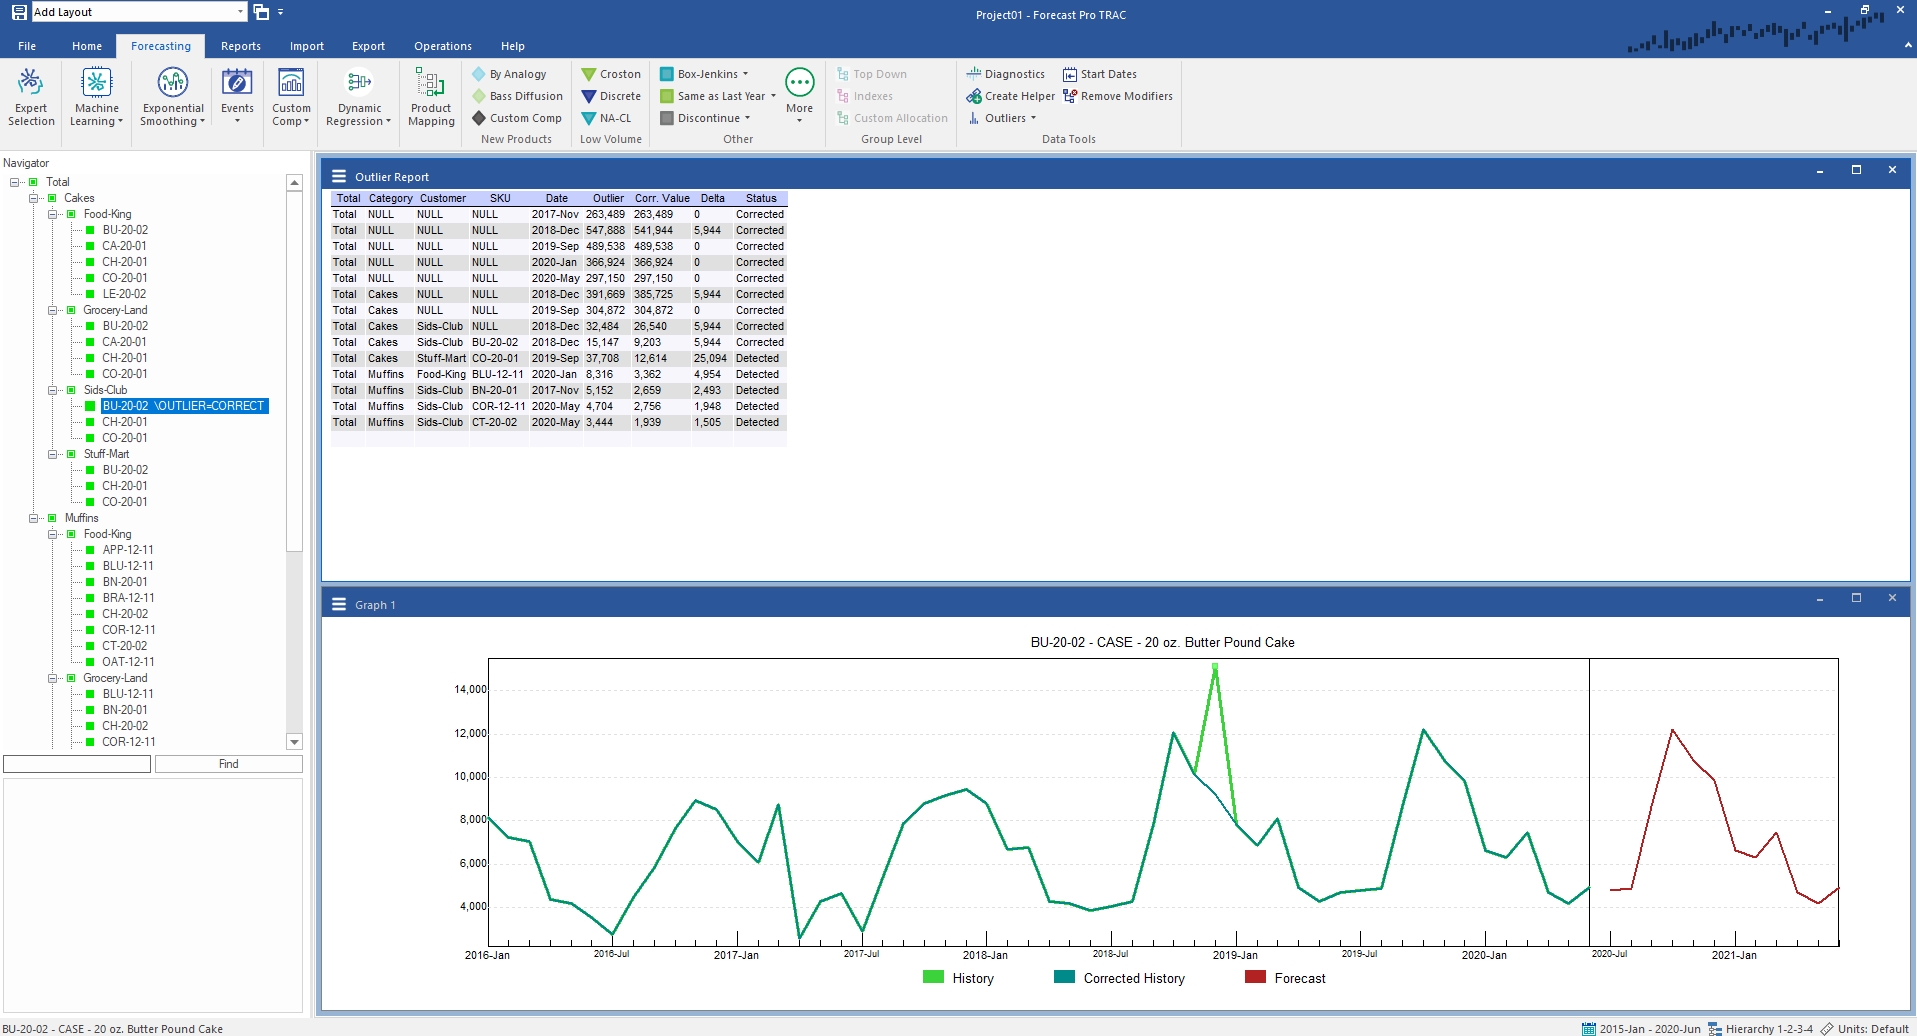
Double-click on the first item listed on the outlier report. Your display should now match the one shown below.

Notice that when you double-click an item on the outlier report, the Navigator jumps directly to that item. Thus, you can use the outlier report as the equivalent of a Hot List to navigate through the listed items. All of the global report views support this kind of navigation.
Notice that December 2018 outlier is shown with a marker on the graph and adding in Corrected History allows us to see the suggested correction. The data point is rather unusual and you can see that the forecast has a spike in December, which is why it was flagged as an outlier.
Select the Forecasting tab. In the Tools group, open the Outliers drop-down and select Corrected. Notice that the status in the outlier report has changed to Corrected and that correcting for this outlier has changed the shape of the forecasts.
Double-click on the next item on the outlier report. Here too, we have a significant outlier and will want to correct for it. Examine the remaining items on the Hot List and experiment with the Outlier options on the Outliers icon drop-down. When you are comfortable with their operation, exit the program.
This concludes the Detecting and Correcting Outliers lesson.