

We’ll begin this lesson by generating a forecast for the cakes and muffins data that we have explored in prior lessons.
Click on the “New Project” icon to go to the Forecast Pro main window.
Make sure you are on the Home tab and click the Data Manager icon.
Click the Add drop down on the Historic Data row, select Excel and select 123 Bakery – Historic Data.xlsx to add it to the Historic Data row.
Click the Add drop down on the Overrides row, select Excel and select 123 Bakery - Overrides - Transactions.xlsx to add it to the Overrides row. The Overrides row allows you to load previously created overrides from either a data source or project file.
Your Data Manager should now match the one below.
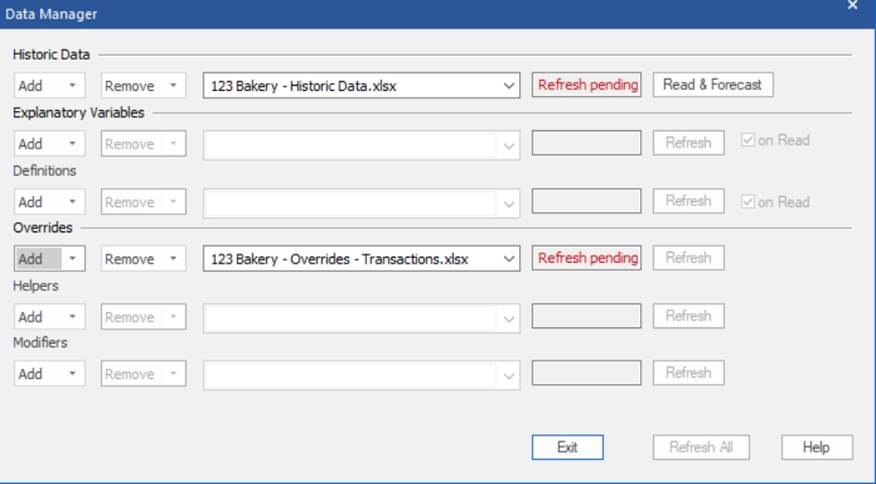
Click the Read & Forecast button to read in the historic demand data and generate the statistical forecasts.
Click the Exit button to exit the Data Manager.