

Start Forecast Pro and open a new project. Click the Data Manager to call up the Data Manager.
Click the Add drop-down on the Historic Data row, select Excel and select Presto Camera Company.xls to add it to the Historic Data row.
Click the Read & Forecast button to read in the historic demand data and generate the statistical forecasts.
Click the Exit button to exit the Data Manager.
Close the Override view, open the Forecast Report and fully expand the Navigator. Your screen should now look like the one shown below.
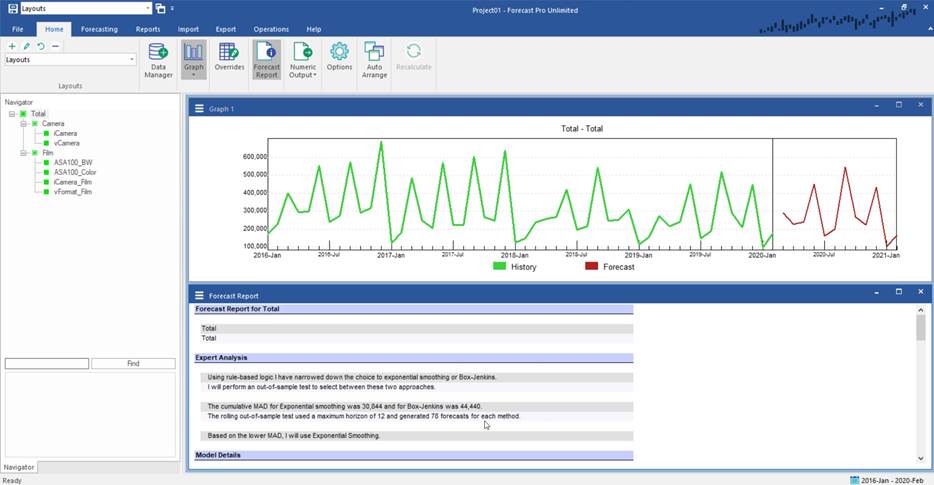
Notice that the Navigator tree structure matches the hierarchy shown below.
|
|
|
|
Total |
|
||||||||||||||||||||||||||||
|
|
|
|
|
|
|
|||||||||||||||||||||||||||
|
|
|
|
|
|
|
|
||||||||||||||||||||||||||
|
|
|
Camera |
|
Film |
|
|||||||||||||||||||||||||||
|
|
|
|
|
|
|
|||||||||||||||||||||||||||
|
|
|
|
|
|
|
|
|
|
||||||||||||||||||||||||
|
|
iCamera |
|
vCamera |
|
ASA100_BW |
|
ASA100_Color |
|
Etc. |
|||||||||||||||||||||||
The tree contains three group variables (Total, Camera and Film). The tree also contains six end items (iCamera, vCamera, ASA100_BW, ASA100_Color, iCamera_Film and vFormat_Film). The demand histories for group variables are not in the database. They are created by Forecast Pro by aggregating the appropriate end items. Thus, the history for the group Camera is defined as the sum of iCamera + vCamera. The history for the group Film is defined as the sum of ASA100_BW + ASA100_Color + iCamera_Film + vFormat_Film. The history for the group Total is defined as the sum of the groups Camera + Film.
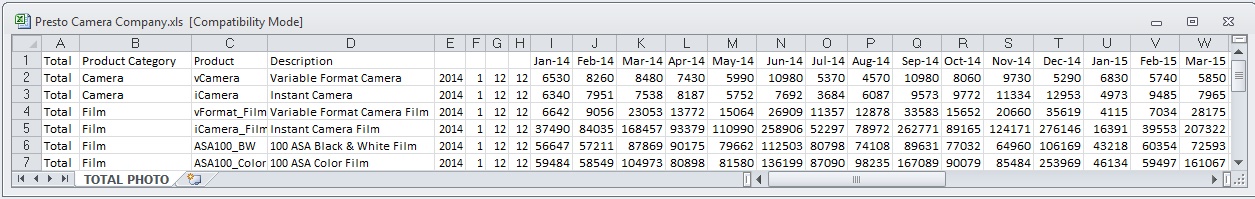
The spreadsheet Presto Camera Company.xls is shown above.
The groups Total, Camera and Film are defined using attribute fields (columns A and B).
If we had included additional attribute fields, we would have created a larger hierarchy. Consult the Data Considerations lesson and Setting Up Your Historic Data in the Forecast Pro Reference Manual for complete details.