The next step is to define the historic demand data you wish to forecast and any other inputs you would like to use.
In this example we will prepare sales forecasts for 123 Bakery. The data consist of monthly sales of Cakes and Muffins.
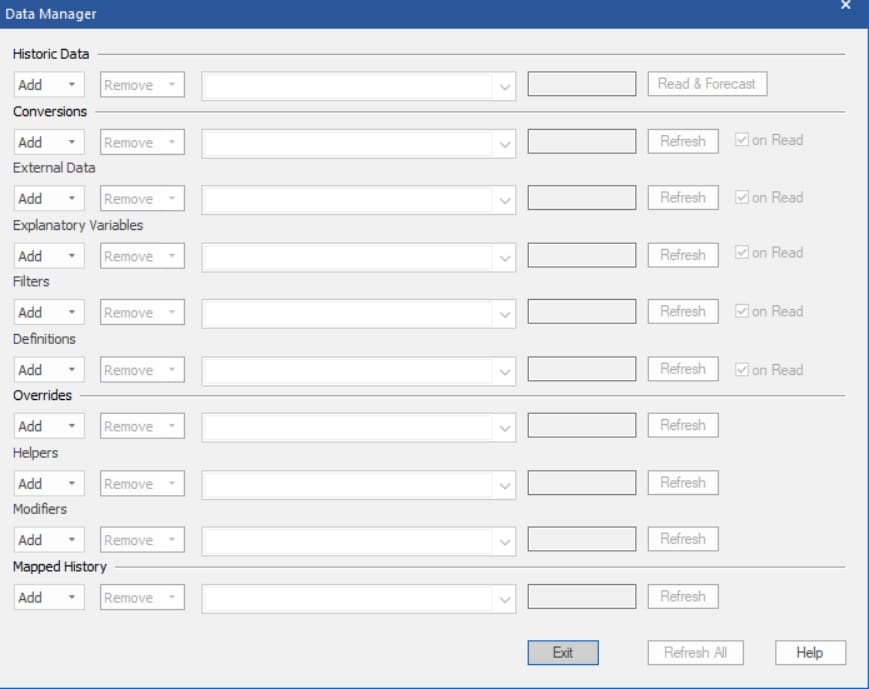
Click the Data Manager icon to open the Data Manager shown below.

The Historic Data row on the Data Manager is used to specify the demand histories for the items you wish to forecast. The remaining rows are used to define other (optional) inputs. We will explore these options in future lessons. For all rows, the Add drop-down is used to specify the file(s) or ODBC table(s) containing the relevant inputs.
Click the Add drop-down on the Historic Data row, select Excel and select 123 Bakery – Historic Data.xlsx to add it to the Historic Data row.
When you list a data file in the Historic Data row, the program will forecast every series in the data file.
Notice that the Historic Data row includes a button labeled Read & Forecast. As you probably guessed, clicking the button will read in the data and generate the forecasts. Before we perform this action, let’s define some other inputs to use.
Click the Add drop-down on the Conversions row, select Excel and then select 123 Bakery – Conversions.xlsx to add it to the Conversions row. The historic demand in our example is in cases. 123 Bakery – Conversions.xlsx contains conversion factors that allow us to view the forecasts in dollars, kilos and pallets.
Click the Add drop-down on the Filters row, select Excel and select 123 Bakery – Filters.xls to add it to the Filters row. 123 Bakery – Filters.xlsx contains filter fields for the Sales Rep and Corporate Pareto Code associated with each end item. Filter fields are often useful when customizing reports and data displays.
Notice that, except for the Historic Data row, all rows have a Refresh button and five of the rows have an “on Read” checkbox. After the historic data has been read and forecasted, the Refresh button can be used to load the specified, optional data files. If the “on Read” checkbox is selected for a file, that file will be automatically read in whenever you hit the Read and Forecast button. The “on Read” option is useful when the associated data will be changing each forecast period. We will discuss how each of these files is used by Forecast Pro in future lessons.

Your Data Manager should look like the one above.
Click the Read & Forecast button to read in the data and generate the forecasts. Click the Exit button to exit the Data Manager.

