 Box-Jenkins (ARIMA) is an important forecasting method that can yield highly accurate forecasts for certain types of data. In this installment of Forecasting 101 we’ll examine the pros and cons of Box-Jenkins modeling, provide a conceptual overview of how the technique works and discuss how best to apply it to business data.
A Bit of History
In 1970 George Box and Gwilym Jenkins popularized ARIMA (Autoregressive Integrated Moving Average) models in their seminal textbook, Time Series Analysis: Forecasting and Control1. Technically, the forecasting technique described in the text is an ARIMA model, however many forecasters (including the author) use the phrases “ARIMA models” and “Box-Jenkins models” interchangeably.
ARIMA models initially generated a lot of excitement in the academic community, due mostly to their theoretical underpinnings which proved that if certain assumptions were met, the models would yield optimal forecasts.
Early on, the technique did not enjoy widespread use among the business community. This was mostly due to the difficult, time consuming and highly subjective procedure described by Box and Jenkins to identify the proper form of the model for a given data set. To make matters worse, empirical studies showed that despite the ARIMA model’s theoretical superiority over other forecasting methods, in practice the models did NOT routinely outperform other time series methods.
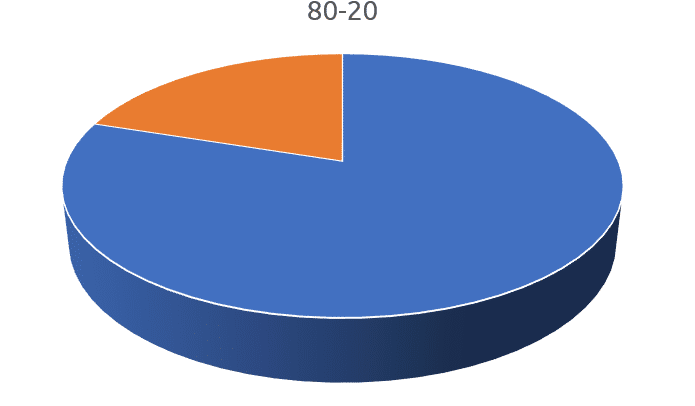
One particularly important empirical study found that exponential smoothing models outperformed Box-Jenkins 55% of the time on a sample of 1,001 data sets2. This is still a good showing for Box-Jenkins (it outperformed exponential smoothing 45% of the time), so the lesson here, is that ideally one would switch between different approaches as appropriate rather than taking a one-size-fits-all approach.
The challenge for a corporate forecaster is to determine what data sets are best suited to Box-Jenkins and then to identify the proper form of the model.

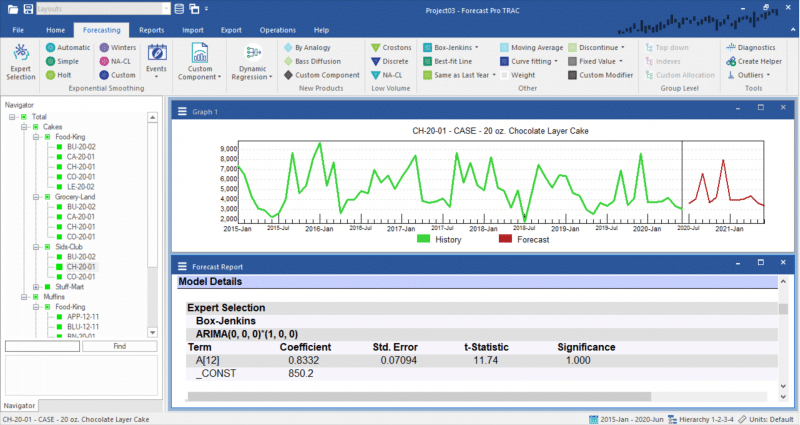
The screenshot above shows the forecast generated from an ARIMA model along with the expert selection logic and model details.
Today, software packages such as Forecast Pro use automatic algorithms to decide both when to use Box-Jenkins models and to automatically identify the proper form of the model. These automatic approaches have been shown to outperform the manual identification procedures and have made Box-Jenkins models accessible and useful to the business forecasting community3.
Conceptual Overview
Although multivariate forms of ARIMA models exist, most business use of the method is as a time series forecasting technique. (Time series methods are forecasting techniques that base the forecast solely on the history of the item you are forecasting.)
As a time series technique, ARIMA models are appropriate when you can assume a reasonable amount of continuity between the past and the future. The models are best suited to shorter-tem forecasting—say 18 months or less—due to their assumption that future patterns and trends will resemble current patterns and trends. This is a reasonable assumption in the short term, but becomes more tenuous the further out you forecast.
Box-Jenkins models are similar to exponential smoothing models in that they are adaptive, can model trends and seasonal patterns, and can be automated. They differ in that they are based on autocorrelations (patterns in time) rather than a structural view of level, trend and seasonality. Box-Jenkins tends to succeed better than exponential smoothing for longer, more stable data sets and not as well for noisier, more volatile data.
Box-Jenkins models are mathematically complex. In this article, we will provide a very basic conceptual overview of how an ARIMA model works and introduce some notation associated with the model. If you’re interested in learning more about Box-Jenkins models, they are covered in detail in the Forecast Pro Statistical Reference Manual and in virtually every academic textbook on time series forecasting.
An ARIMA model has 3 components, each of which helps to model different types of patterns. The “AR” stands for autoregressive. The “I” stands for integrated. The “MA” stands for moving average. Each component has an associated model order which indicates how large the component is.
Generically, a non-seasonal Box-Jenkins model is symbolized as ARIMA(p,d,q) where “p” indicates the number of AR terms, “d” indicates the order of differencing, and “q” indicates the number of MA terms. A seasonal Box-Jenkins model is symbolized as ARIMA(p,d,q)*(P,D,Q), where the p,d,q indicates the model orders for the short-term components of the model and P,D,Q indicate the model orders for the seasonal components of the model.
Identifying the proper Box-Jenkins models requires determining the model orders. Theoretically, the model orders could take on any integer values; in practice they are usually 0, 1, 2 or 3. This still yields hundreds of different models to consider—one of the reasons why manually identifying the models is so difficult.
Summary
Box-Jenkins is an important forecasting method that can generate more accurate forecasts than other time series methods for certain types of data. As originally formulated, model identification relied upon a difficult, time consuming and highly subjective procedure.
Today, software packages such as Forecast Pro use automatic algorithms to both decide when to use Box-Jenkins models and to automatically identify the proper form of the model. These automatic approaches have made Box-Jenkins models accessible and useful to the business forecast forecasting community.
1G. E. P. Box and G. M. Jenkins [1976] Time Series Analysis: Forecasting and Control, Revised Edition, San Francisco: Holden Day.
2S. Makridakis et al. [1984] The Forecasting Accuracy of Major Time Series Methods, Chichister: Wiley.
3A study by Spyros Makridakis and one by the American Statistician both showed Forecast Pro’s automatic Box-Jenkins procedure to outperform manual identification by human experts. Refer to the previous Makridakis reference and to: Keith Ord and Sam Lowe [1996] Automatic Forecasting, The American Statistician, Volume 50, Number 1, pp. 88 94.
About the author:


