Measuring forecast accuracy is critical for benchmarking and continuously improving your forecasting process, but where do we start? This article explores why we should measure accuracy, what we need to track, and the key metrics we need to understand to make sense of the data.
Why should I measure forecast accuracy?
1. Improving your forecasting process requires the ability to track accuracy.
Forecasting should be viewed as a continuous improvement process. Your forecasting team should be constantly striving to improve the forecasting process and forecast accuracy. Doing so requires knowing what is working and what is not.
For example, many organizations generate baseline forecasts using statistical approaches and then make judgmental adjustments to them to capture their knowledge of future events. Organizations that track the accuracy of both the statistical and adjusted forecasts learn where the adjustments improve the forecasts and where they make them worse. This knowledge allows them to focus their time and attention on the items where the adjustments are adding value.
2. Tracking accuracy provides insight into expected performance.
A forecast is more than a number. To use a forecast effectively you need an understanding of the expected accuracy.
Within-sample statistics and confidence limits provide some insight into expected accuracy; however, they almost always underestimate the actual (out-of-sample) forecasting error. This is due to the fact that the parameters of a statistical model are selected to minimize the fitted error over the historic data. The parameters are thus adapted to the historic data, and reflect any of its peculiarities. Put another way, the model is optimized for the past—not for the future.
Generally speaking, out-of-sample statistics (i.e., historic forecast errors) yield a better measure of expected forecast accuracy than within-sample statistics.
3. Tracking accuracy allows you to benchmark your forecasts.
If you are lucky enough to be in an industry with published statistics on forecast accuracy, comparing your accuracy to these benchmarks provides insight into your forecasting effectiveness. If industry benchmarks are not available (usually the case), periodically benchmarking your current forecast accuracy against your earlier forecast accuracy allows you to measure your improvement.
4. Monitoring forecast accuracy allows you to spot problems early.
An abrupt unexpected change in forecast accuracy is often the result of some underlying event. For example, if unbeknownst to you, a key customer decides to carry a competing product, your first indication might be an unusually large forecast error. Routinely monitoring forecast errors allows you to spot, investigate and respond to these changes early on—before they turn into bigger problems.
Building a Forecast Archive
Tracking forecast accuracy requires that you maintain a record of previously generated forecasts. This record of the previously generated forecasts is referred to as the forecast archive.
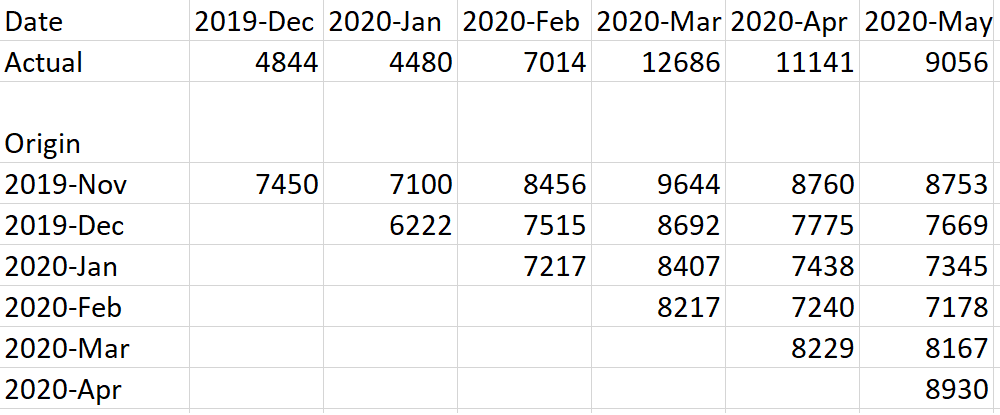
The table above shows a very simple forecast archive for a single product. The first row contains the forecast that was generated in November 2019. The second row contains the forecast that was generated in December 2019, etc.
If your forecasting process generates multiple forecasts (e.g., statistical forecast, adjusted forecast, sales person’s forecast, etc.), then all of the forecasts should be saved to the forecast archive.
Once the archive has been established, it can be used to generate reports comparing the archived forecasts to the actual sales. Due to the volume and complexity of the data, this is best accomplished using either a dedicated software solution such as Forecast Pro TRAC or an internally developed solution that utilizes a relational database—it is not a job for Excel.
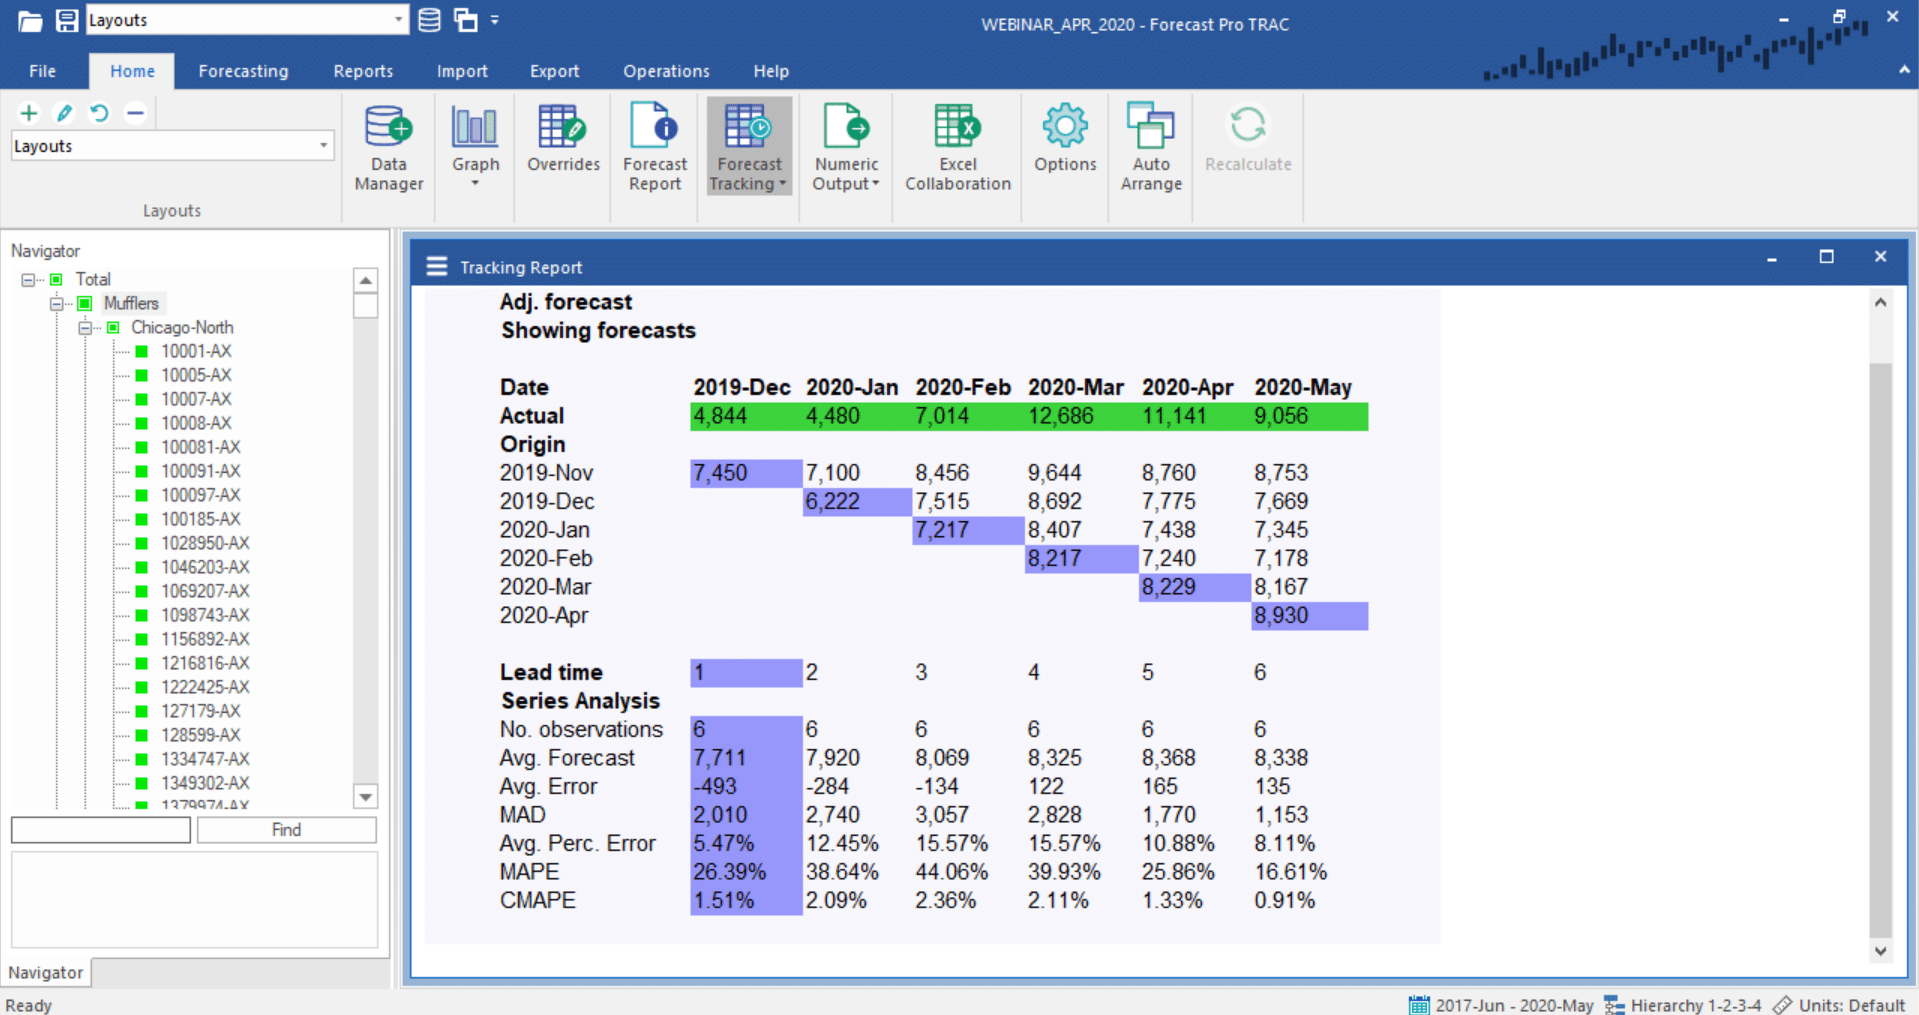
The screenshot above shows a sample accuracy tracking report. Due to its cascading-like appearance, this style report is often referred to as a waterfall report. The top half of the numeric section (the “Forecast Report” section) displays the actual demand history and the archived forecasts for the periods being analyzed. The lower half displays summary statistics for different lead times.
A Brief Guide to Forecast Accuracy Metrics and How to Use Them
The MAPE. The MAPE (Mean Absolute Percent Error) measures the size of the error in percentage terms. It is calculated as the average of the unsigned percentage error, as shown in the example below:
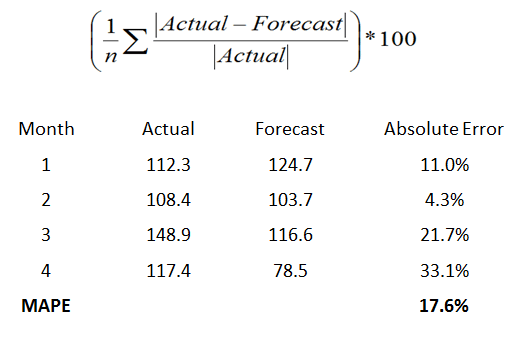
Many organizations focus primarily on the MAPE when assessing forecast accuracy. SInce most people are comfortable thinking in percentage terms, the MAPE is easy to interpret. It can also convey information when you don’t know the item’s demand volume. For example, telling your manager “we were off by less than 4%” is more meaningful than saying “we were off by 3,000 cases” if your manager doesn’t know an item’s typical demand volume.
The MAPE is scale sensitive and should not be used when working with low-volume data. Notice that because “Actual” is in the denominator of the equation, the MAPE is undefined when Actual demand is zero. Furthermore, when the Actual value is not zero, but quite small, the MAPE will often take on extreme values. This scale sensitivity renders the MAPE ineffective as an error measure for low-volume data.
The MAD. The MAD (Mean Absolute Deviation) measures the size of the error in units. It is calculated as the average of the unsigned errors, as shown in the example below:
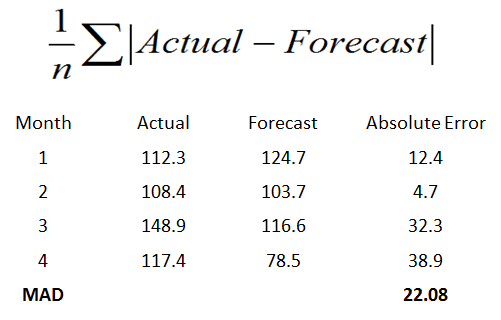
The MAD is a good statistic to use when analyzing the error for a single item; however, if you aggregate MADs over multiple items you need to be careful about high-volume products dominating the results—more on this later.
The MAPE and the MAD are by far the most commonly used error measurement statistics. There are a slew of alternative statistics in the forecasting literature, many of which are variations on the MAPE and the MAD. A few of the more important ones are listed below:
MAD/Mean Ratio. The MAD/Mean ratio is an alternative to the MAPE that is better suited to intermittent and low-volume data. As stated previously, percentage errors cannot be calculated when the Actual equals zero and can take on extreme values when dealing with low-volume data. These issues are magnified when you start to average MAPEs over multiple time series. The MAD/Mean ratio tries to overcome this problem by dividing the MAD by the Mean—essentially rescaling the error to make it comparable across time series of varying scales. The statistic is calculated exactly as the name suggests—it is simply the MAD divided by the Mean.
GMRAE. The GMRAE (Geometric Mean Relative Absolute Error) is used to measure out-of-sample forecast performance. It is calculated using the relative error between the naïve model (i.e., next period’s forecast is this period’s actual) and the currently selected model. A GMRAE of 0.54 indicates that the size of the current model’s error is only 54% of the size of the error generated using the naïve model for the same data set. Because the GMRAE is based on a relative error, it is less scale sensitive than the MAPE and the MAD.
SMAPE. The SMAPE (Symmetric Mean Absolute Percentage Error) is a variation on the MAPE that is calculated using the average of the absolute value of the actual and the absolute value of the forecast in the denominator. This statistic is preferred to the MAPE by some and was used as an accuracy measure in several forecasting competitions.
Measuring Error for a Single Item vs. Measuring Errors Across Multiple Items
Measuring forecast error for a single item is pretty straightforward.
If you are working with an item which has reasonable demand volume, any of the aforementioned error measurements can be used. You should select the one that you and your organization are most comfortable with—for many organizations this will be the MAPE or the MAD. If you are working with a low-volume item then the MAD is a good choice, while the MAPE and other percentage-based statistics should be avoided.
Calculating error measurement statistics across multiple items can be quite problematic.
Calculating an aggregated MAPE is a common practice. A potential problem with this approach is that the lower-volume items (which will usually have higher MAPEs) can dominate the statistic. This is usually not desirable. One solution is to first segregate the items into different groups based upon volume (e.g., ABC categorization) and then calculate separate statistics for each group. Another approach is to establish a weight for each item’s MAPE that reflects the item’s relative importance to the organization—this is an excellent practice.
Since the MAD is a unit error, calculating an aggregated MAD across multiple items only makes sense when using comparable units. For example, if you measure the error in dollars then the aggregated MAD will tell you the average error in dollars.
Summary
Tracking forecast accuracy is an essential part of the forecasting process. If you cannot assess the accuracy of your current process, it is very difficult to improve it. In addition, tracking forecast accuracy provides insight into expected performance, enables you to benchmark your forecasts and allows you to spot, investigate and respond to problems earlier.
To track accuracy, we must store forecasts over time so that we can later compare these forecasts to what actually happened. This can be done in something as simple as Excel but can be cumbersome for large data sets–dedicated software is recommended.
As far as forecast accuracy metrics, the MAPE and MAD are the most commonly used error measurement statistics; however, both can be misleading under certain circumstances. The MAPE is scale sensitive and care needs to be taken when using the MAPE with low-volume items. All error measurement statistics can be problematic when aggregated over multiple items and as a forecaster you need to carefully think through your approach when doing so.
Forecast Pro is a dedicated software package that is designed to automatically archive forecasts for you while calculating key error measurement statistics. If you’d like to talk to us about how Forecast Pro might help you better measure your forecast performance, contact us.


